Salvadoran vs Iraqi Median Household Income
COMPARE
Salvadoran
Iraqi
Median Household Income
Median Household Income Comparison
Salvadorans
Iraqis
$82,449
MEDIAN HOUSEHOLD INCOME
15.4/ 100
METRIC RATING
211th/ 347
METRIC RANK
$83,753
MEDIAN HOUSEHOLD INCOME
29.6/ 100
METRIC RATING
191st/ 347
METRIC RANK
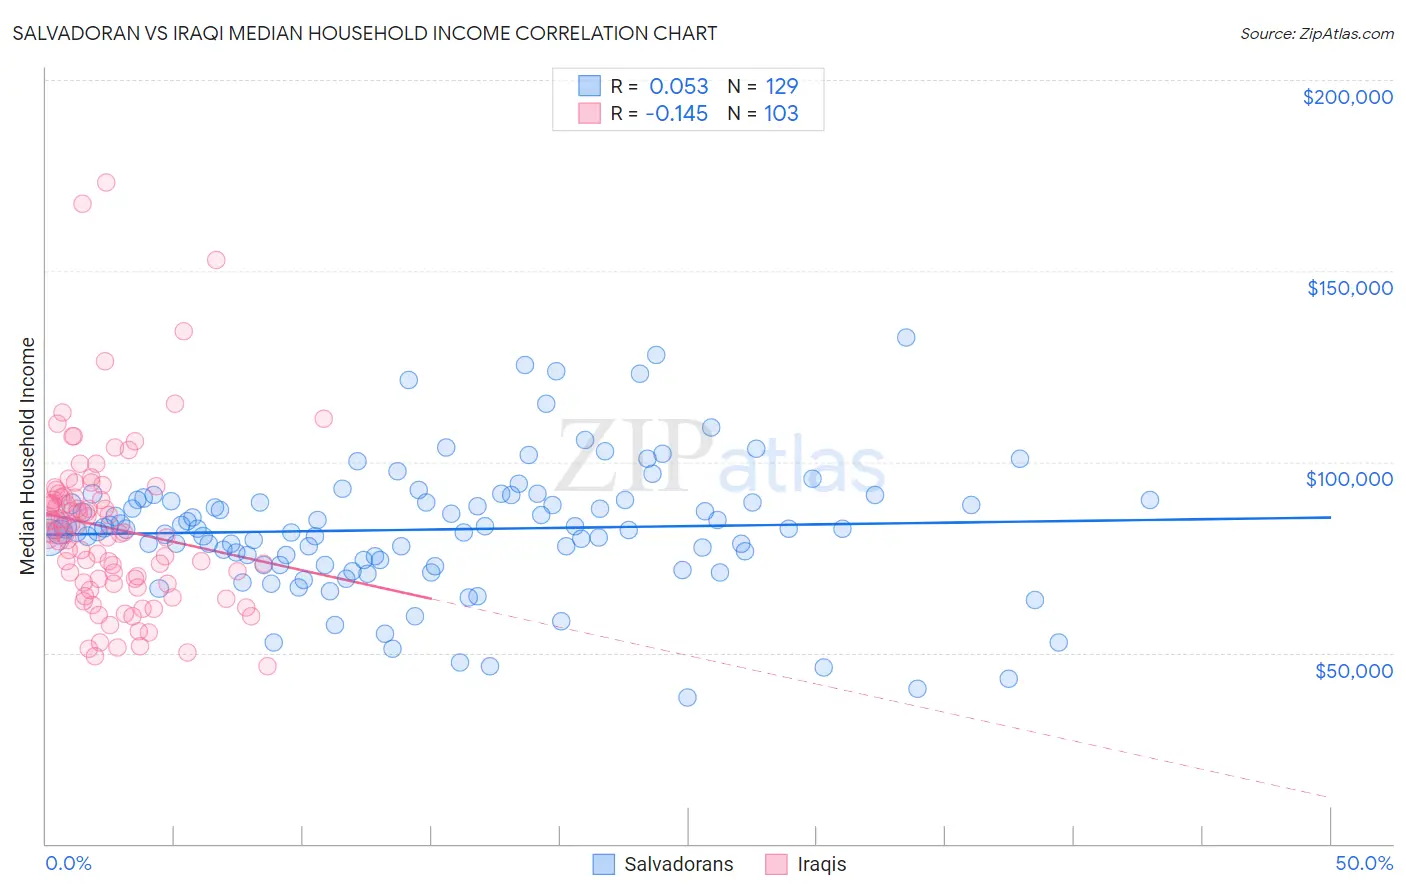
Salvadoran vs Iraqi Median Household Income Correlation Chart
The statistical analysis conducted on geographies consisting of 398,609,851 people shows a slight positive correlation between the proportion of Salvadorans and median household income in the United States with a correlation coefficient (R) of 0.053 and weighted average of $82,449. Similarly, the statistical analysis conducted on geographies consisting of 170,587,047 people shows a poor negative correlation between the proportion of Iraqis and median household income in the United States with a correlation coefficient (R) of -0.145 and weighted average of $83,753, a difference of 1.6%.
Median Household Income Correlation Summary
| Measurement | Salvadoran | Iraqi |
| Minimum | $38,281 | $46,565 |
| Maximum | $132,625 | $173,015 |
| Range | $94,344 | $126,450 |
| Mean | $82,302 | $82,738 |
| Median | $82,350 | $81,250 |
| Interquartile 25% (IQ1) | $73,617 | $68,093 |
| Interquartile 75% (IQ3) | $90,029 | $91,098 |
| Interquartile Range (IQR) | $16,412 | $23,005 |
| Standard Deviation (Sample) | $17,071 | $22,309 |
| Standard Deviation (Population) | $17,005 | $22,201 |
Demographics Similar to Salvadorans and Iraqis by Median Household Income
In terms of median household income, the demographic groups most similar to Salvadorans are Immigrants from Uruguay ($82,560, a difference of 0.14%), Immigrants from Iraq ($82,594, a difference of 0.18%), French Canadian ($82,810, a difference of 0.44%), Dutch ($82,971, a difference of 0.63%), and Immigrants from Kenya ($83,068, a difference of 0.75%). Similarly, the demographic groups most similar to Iraqis are Welsh ($83,628, a difference of 0.15%), Finnish ($83,607, a difference of 0.18%), Ghanaian ($83,582, a difference of 0.21%), Immigrants from Armenia ($83,555, a difference of 0.24%), and French ($83,468, a difference of 0.34%).
| Demographics | Rating | Rank | Median Household Income |
| Iraqis | 29.6 /100 | #191 | Fair $83,753 |
| Welsh | 28.0 /100 | #192 | Fair $83,628 |
| Finns | 27.7 /100 | #193 | Fair $83,607 |
| Ghanaians | 27.4 /100 | #194 | Fair $83,582 |
| Immigrants | Armenia | 27.0 /100 | #195 | Fair $83,555 |
| French | 26.0 /100 | #196 | Fair $83,468 |
| Aleuts | 25.7 /100 | #197 | Fair $83,446 |
| Japanese | 25.1 /100 | #198 | Fair $83,395 |
| Germans | 24.6 /100 | #199 | Fair $83,358 |
| Tsimshian | 24.5 /100 | #200 | Fair $83,346 |
| Spanish | 24.4 /100 | #201 | Fair $83,343 |
| Immigrants | Thailand | 24.3 /100 | #202 | Fair $83,327 |
| Immigrants | Cambodia | 24.0 /100 | #203 | Fair $83,304 |
| Immigrants | Africa | 23.8 /100 | #204 | Fair $83,289 |
| Celtics | 22.7 /100 | #205 | Fair $83,193 |
| Immigrants | Kenya | 21.3 /100 | #206 | Fair $83,068 |
| Dutch | 20.3 /100 | #207 | Fair $82,971 |
| French Canadians | 18.7 /100 | #208 | Poor $82,810 |
| Immigrants | Iraq | 16.7 /100 | #209 | Poor $82,594 |
| Immigrants | Uruguay | 16.4 /100 | #210 | Poor $82,560 |
| Salvadorans | 15.4 /100 | #211 | Poor $82,449 |