Russian vs Immigrants from Lithuania Wage/Income Gap
COMPARE
Russian
Immigrants from Lithuania
Wage/Income Gap
Wage/Income Gap Comparison
Russians
Immigrants from Lithuania
28.0%
WAGE/INCOME GAP
0.5/ 100
METRIC RATING
280th/ 347
METRIC RANK
28.6%
WAGE/INCOME GAP
0.1/ 100
METRIC RATING
311th/ 347
METRIC RANK
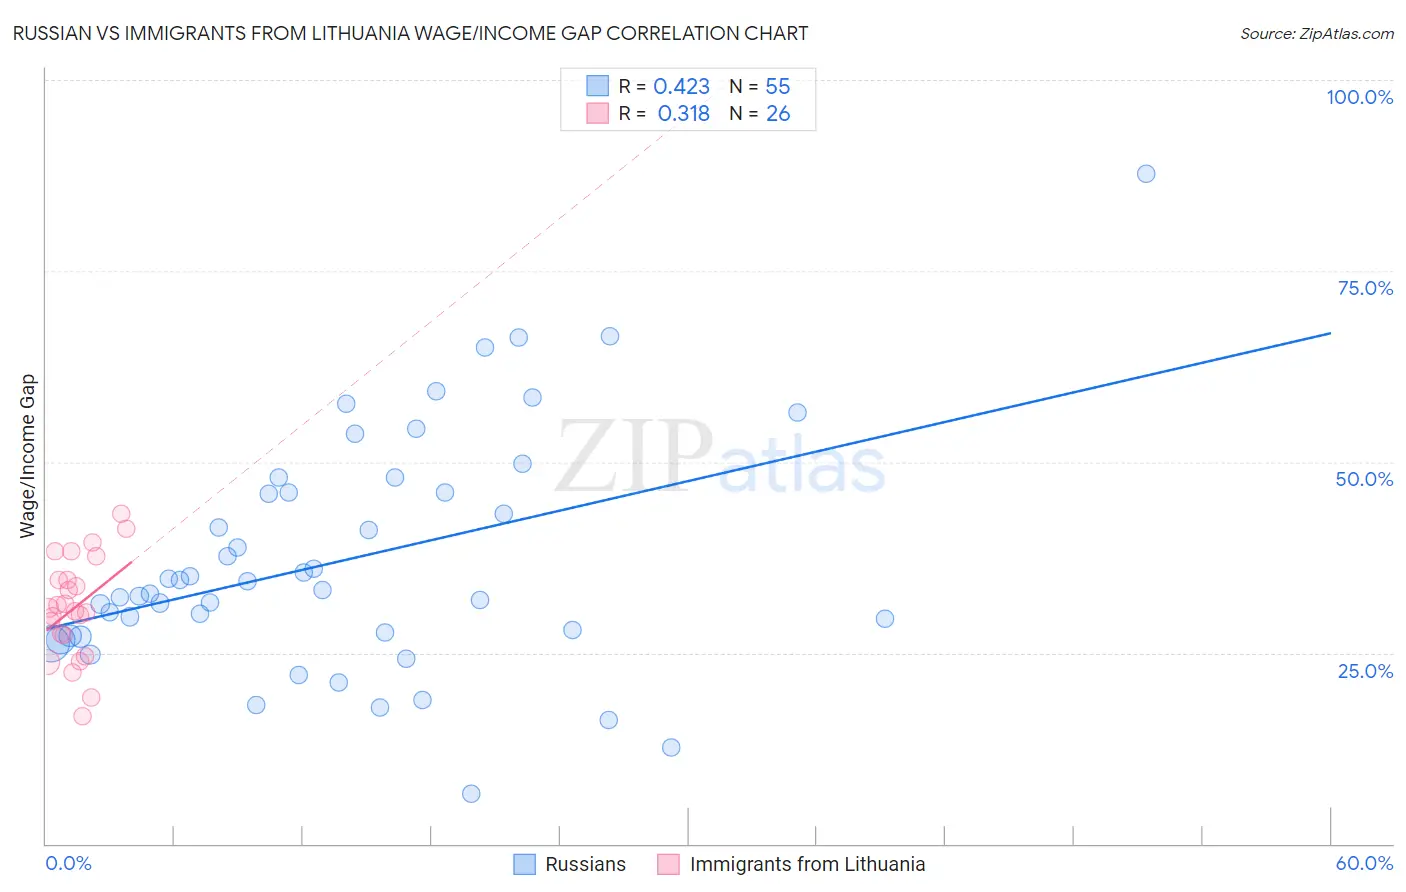
Russian vs Immigrants from Lithuania Wage/Income Gap Correlation Chart
The statistical analysis conducted on geographies consisting of 511,171,536 people shows a moderate positive correlation between the proportion of Russians and wage/income gap percentage in the United States with a correlation coefficient (R) of 0.423 and weighted average of 28.0%. Similarly, the statistical analysis conducted on geographies consisting of 117,698,624 people shows a mild positive correlation between the proportion of Immigrants from Lithuania and wage/income gap percentage in the United States with a correlation coefficient (R) of 0.318 and weighted average of 28.6%, a difference of 2.2%.
Wage/Income Gap Correlation Summary
| Measurement | Russian | Immigrants from Lithuania |
| Minimum | 6.5% | 16.8% |
| Maximum | 87.7% | 43.2% |
| Range | 81.2% | 26.5% |
| Mean | 37.1% | 30.9% |
| Median | 33.2% | 30.7% |
| Interquartile 25% (IQ1) | 27.2% | 27.3% |
| Interquartile 75% (IQ3) | 46.0% | 34.5% |
| Interquartile Range (IQR) | 18.8% | 7.3% |
| Standard Deviation (Sample) | 15.5% | 6.7% |
| Standard Deviation (Population) | 15.3% | 6.5% |
Similar Demographics by Wage/Income Gap
Demographics Similar to Russians by Wage/Income Gap
In terms of wage/income gap, the demographic groups most similar to Russians are Burmese (28.0%, a difference of 0.050%), South African (28.0%, a difference of 0.080%), Romanian (28.0%, a difference of 0.15%), French Canadian (28.1%, a difference of 0.26%), and Immigrants from Sweden (28.1%, a difference of 0.26%).
| Demographics | Rating | Rank | Wage/Income Gap |
| Bulgarians | 0.7 /100 | #273 | Tragic 27.8% |
| Americans | 0.7 /100 | #274 | Tragic 27.8% |
| Immigrants | Japan | 0.7 /100 | #275 | Tragic 27.9% |
| Lebanese | 0.7 /100 | #276 | Tragic 27.9% |
| Latvians | 0.7 /100 | #277 | Tragic 27.9% |
| Immigrants | England | 0.6 /100 | #278 | Tragic 27.9% |
| Romanians | 0.5 /100 | #279 | Tragic 28.0% |
| Russians | 0.5 /100 | #280 | Tragic 28.0% |
| Burmese | 0.5 /100 | #281 | Tragic 28.0% |
| South Africans | 0.5 /100 | #282 | Tragic 28.0% |
| French Canadians | 0.4 /100 | #283 | Tragic 28.1% |
| Immigrants | Sweden | 0.4 /100 | #284 | Tragic 28.1% |
| Italians | 0.4 /100 | #285 | Tragic 28.1% |
| Immigrants | Austria | 0.4 /100 | #286 | Tragic 28.1% |
| Okinawans | 0.4 /100 | #287 | Tragic 28.1% |
Demographics Similar to Immigrants from Lithuania by Wage/Income Gap
In terms of wage/income gap, the demographic groups most similar to Immigrants from Lithuania are Finnish (28.6%, a difference of 0.070%), Eastern European (28.6%, a difference of 0.13%), Macedonian (28.6%, a difference of 0.16%), Polish (28.5%, a difference of 0.25%), and French (28.7%, a difference of 0.26%).
| Demographics | Rating | Rank | Wage/Income Gap |
| Immigrants | Netherlands | 0.2 /100 | #304 | Tragic 28.5% |
| Immigrants | South Africa | 0.1 /100 | #305 | Tragic 28.5% |
| Whites/Caucasians | 0.1 /100 | #306 | Tragic 28.5% |
| Immigrants | Denmark | 0.1 /100 | #307 | Tragic 28.5% |
| Poles | 0.1 /100 | #308 | Tragic 28.5% |
| Macedonians | 0.1 /100 | #309 | Tragic 28.6% |
| Finns | 0.1 /100 | #310 | Tragic 28.6% |
| Immigrants | Lithuania | 0.1 /100 | #311 | Tragic 28.6% |
| Eastern Europeans | 0.1 /100 | #312 | Tragic 28.6% |
| French | 0.1 /100 | #313 | Tragic 28.7% |
| Immigrants | Scotland | 0.1 /100 | #314 | Tragic 28.7% |
| Maltese | 0.1 /100 | #315 | Tragic 28.7% |
| Lithuanians | 0.1 /100 | #316 | Tragic 28.7% |
| Belgians | 0.1 /100 | #317 | Tragic 28.8% |
| Basques | 0.1 /100 | #318 | Tragic 28.8% |