Russian vs Immigrants from Central America Wage/Income Gap
COMPARE
Russian
Immigrants from Central America
Wage/Income Gap
Wage/Income Gap Comparison
Russians
Immigrants from Central America
28.0%
WAGE/INCOME GAP
0.5/ 100
METRIC RATING
280th/ 347
METRIC RANK
24.6%
WAGE/INCOME GAP
93.5/ 100
METRIC RATING
128th/ 347
METRIC RANK
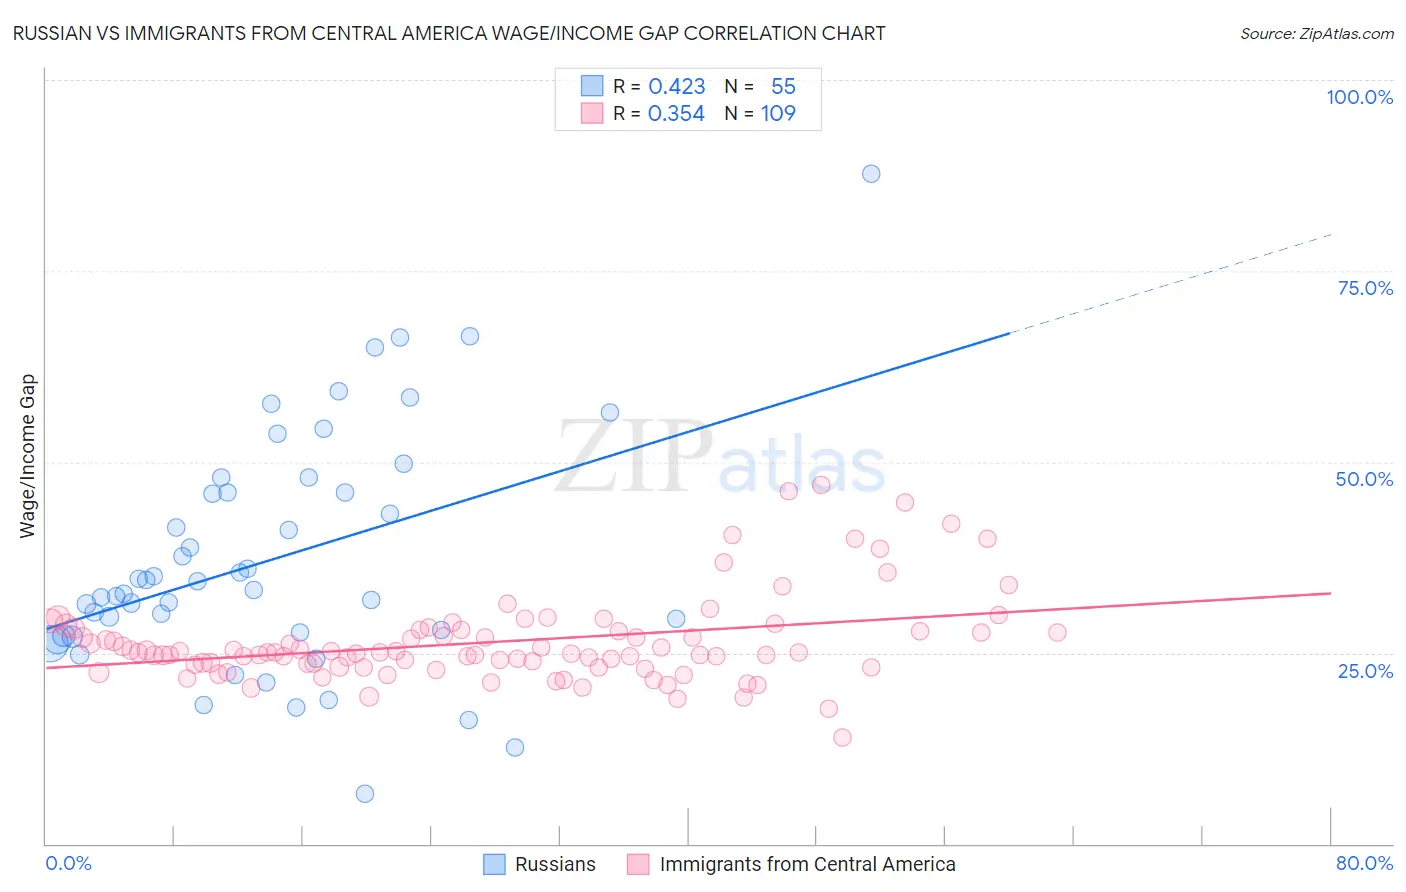
Russian vs Immigrants from Central America Wage/Income Gap Correlation Chart
The statistical analysis conducted on geographies consisting of 511,171,536 people shows a moderate positive correlation between the proportion of Russians and wage/income gap percentage in the United States with a correlation coefficient (R) of 0.423 and weighted average of 28.0%. Similarly, the statistical analysis conducted on geographies consisting of 534,855,009 people shows a mild positive correlation between the proportion of Immigrants from Central America and wage/income gap percentage in the United States with a correlation coefficient (R) of 0.354 and weighted average of 24.6%, a difference of 13.6%.
Wage/Income Gap Correlation Summary
| Measurement | Russian | Immigrants from Central America |
| Minimum | 6.5% | 13.9% |
| Maximum | 87.7% | 47.0% |
| Range | 81.2% | 33.1% |
| Mean | 37.1% | 26.4% |
| Median | 33.2% | 25.0% |
| Interquartile 25% (IQ1) | 27.2% | 23.3% |
| Interquartile 75% (IQ3) | 46.0% | 27.9% |
| Interquartile Range (IQR) | 18.8% | 4.6% |
| Standard Deviation (Sample) | 15.5% | 5.7% |
| Standard Deviation (Population) | 15.3% | 5.7% |
Similar Demographics by Wage/Income Gap
Demographics Similar to Russians by Wage/Income Gap
In terms of wage/income gap, the demographic groups most similar to Russians are Burmese (28.0%, a difference of 0.050%), South African (28.0%, a difference of 0.080%), Romanian (28.0%, a difference of 0.15%), French Canadian (28.1%, a difference of 0.26%), and Immigrants from Sweden (28.1%, a difference of 0.26%).
| Demographics | Rating | Rank | Wage/Income Gap |
| Bulgarians | 0.7 /100 | #273 | Tragic 27.8% |
| Americans | 0.7 /100 | #274 | Tragic 27.8% |
| Immigrants | Japan | 0.7 /100 | #275 | Tragic 27.9% |
| Lebanese | 0.7 /100 | #276 | Tragic 27.9% |
| Latvians | 0.7 /100 | #277 | Tragic 27.9% |
| Immigrants | England | 0.6 /100 | #278 | Tragic 27.9% |
| Romanians | 0.5 /100 | #279 | Tragic 28.0% |
| Russians | 0.5 /100 | #280 | Tragic 28.0% |
| Burmese | 0.5 /100 | #281 | Tragic 28.0% |
| South Africans | 0.5 /100 | #282 | Tragic 28.0% |
| French Canadians | 0.4 /100 | #283 | Tragic 28.1% |
| Immigrants | Sweden | 0.4 /100 | #284 | Tragic 28.1% |
| Italians | 0.4 /100 | #285 | Tragic 28.1% |
| Immigrants | Austria | 0.4 /100 | #286 | Tragic 28.1% |
| Okinawans | 0.4 /100 | #287 | Tragic 28.1% |
Demographics Similar to Immigrants from Central America by Wage/Income Gap
In terms of wage/income gap, the demographic groups most similar to Immigrants from Central America are Yup'ik (24.7%, a difference of 0.050%), Immigrants from Uruguay (24.6%, a difference of 0.070%), German Russian (24.6%, a difference of 0.070%), Alsatian (24.7%, a difference of 0.080%), and Spanish American (24.6%, a difference of 0.090%).
| Demographics | Rating | Rank | Wage/Income Gap |
| Immigrants | Thailand | 94.9 /100 | #121 | Exceptional 24.5% |
| Apache | 94.8 /100 | #122 | Exceptional 24.5% |
| Natives/Alaskans | 94.6 /100 | #123 | Exceptional 24.6% |
| Immigrants | South America | 93.9 /100 | #124 | Exceptional 24.6% |
| Spanish Americans | 93.8 /100 | #125 | Exceptional 24.6% |
| Immigrants | Uruguay | 93.8 /100 | #126 | Exceptional 24.6% |
| German Russians | 93.7 /100 | #127 | Exceptional 24.6% |
| Immigrants | Central America | 93.5 /100 | #128 | Exceptional 24.6% |
| Yup'ik | 93.3 /100 | #129 | Exceptional 24.7% |
| Alsatians | 93.2 /100 | #130 | Exceptional 24.7% |
| Immigrants | Philippines | 93.0 /100 | #131 | Exceptional 24.7% |
| Immigrants | Costa Rica | 92.4 /100 | #132 | Exceptional 24.7% |
| Colombians | 92.4 /100 | #133 | Exceptional 24.7% |
| Mexican American Indians | 92.2 /100 | #134 | Exceptional 24.7% |
| South American Indians | 92.0 /100 | #135 | Exceptional 24.7% |