Russian vs Estonian Wage/Income Gap
COMPARE
Russian
Estonian
Wage/Income Gap
Wage/Income Gap Comparison
Russians
Estonians
28.0%
WAGE/INCOME GAP
0.5/ 100
METRIC RATING
280th/ 347
METRIC RANK
27.1%
WAGE/INCOME GAP
4.3/ 100
METRIC RATING
239th/ 347
METRIC RANK
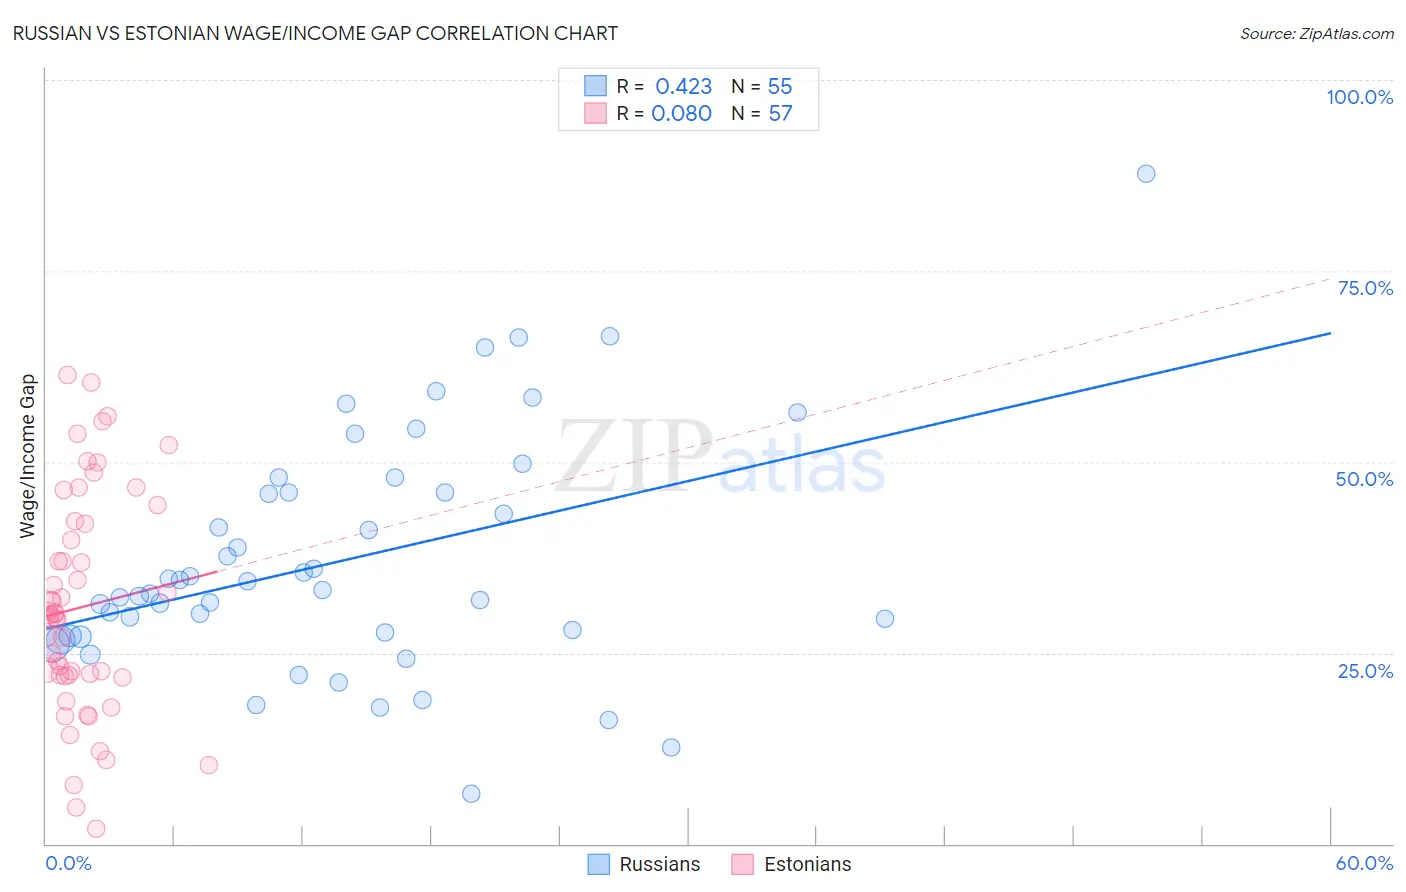
Russian vs Estonian Wage/Income Gap Correlation Chart
The statistical analysis conducted on geographies consisting of 511,171,536 people shows a moderate positive correlation between the proportion of Russians and wage/income gap percentage in the United States with a correlation coefficient (R) of 0.423 and weighted average of 28.0%. Similarly, the statistical analysis conducted on geographies consisting of 123,494,549 people shows a slight positive correlation between the proportion of Estonians and wage/income gap percentage in the United States with a correlation coefficient (R) of 0.080 and weighted average of 27.1%, a difference of 3.4%.
Wage/Income Gap Correlation Summary
| Measurement | Russian | Estonian |
| Minimum | 6.5% | 1.9% |
| Maximum | 87.7% | 61.4% |
| Range | 81.2% | 59.5% |
| Mean | 37.1% | 31.0% |
| Median | 33.2% | 29.9% |
| Interquartile 25% (IQ1) | 27.2% | 22.0% |
| Interquartile 75% (IQ3) | 46.0% | 42.0% |
| Interquartile Range (IQR) | 18.8% | 20.1% |
| Standard Deviation (Sample) | 15.5% | 14.4% |
| Standard Deviation (Population) | 15.3% | 14.3% |
Similar Demographics by Wage/Income Gap
Demographics Similar to Russians by Wage/Income Gap
In terms of wage/income gap, the demographic groups most similar to Russians are Burmese (28.0%, a difference of 0.050%), South African (28.0%, a difference of 0.080%), Romanian (28.0%, a difference of 0.15%), French Canadian (28.1%, a difference of 0.26%), and Immigrants from Sweden (28.1%, a difference of 0.26%).
| Demographics | Rating | Rank | Wage/Income Gap |
| Bulgarians | 0.7 /100 | #273 | Tragic 27.8% |
| Americans | 0.7 /100 | #274 | Tragic 27.8% |
| Immigrants | Japan | 0.7 /100 | #275 | Tragic 27.9% |
| Lebanese | 0.7 /100 | #276 | Tragic 27.9% |
| Latvians | 0.7 /100 | #277 | Tragic 27.9% |
| Immigrants | England | 0.6 /100 | #278 | Tragic 27.9% |
| Romanians | 0.5 /100 | #279 | Tragic 28.0% |
| Russians | 0.5 /100 | #280 | Tragic 28.0% |
| Burmese | 0.5 /100 | #281 | Tragic 28.0% |
| South Africans | 0.5 /100 | #282 | Tragic 28.0% |
| French Canadians | 0.4 /100 | #283 | Tragic 28.1% |
| Immigrants | Sweden | 0.4 /100 | #284 | Tragic 28.1% |
| Italians | 0.4 /100 | #285 | Tragic 28.1% |
| Immigrants | Austria | 0.4 /100 | #286 | Tragic 28.1% |
| Okinawans | 0.4 /100 | #287 | Tragic 28.1% |
Demographics Similar to Estonians by Wage/Income Gap
In terms of wage/income gap, the demographic groups most similar to Estonians are Osage (27.1%, a difference of 0.020%), Immigrants from Eastern Asia (27.1%, a difference of 0.030%), Immigrants from Romania (27.0%, a difference of 0.17%), Immigrants from Europe (27.1%, a difference of 0.18%), and Immigrants from Hungary (27.0%, a difference of 0.19%).
| Demographics | Rating | Rank | Wage/Income Gap |
| Argentineans | 5.2 /100 | #232 | Tragic 27.0% |
| Immigrants | Brazil | 5.0 /100 | #233 | Tragic 27.0% |
| Immigrants | Pakistan | 4.9 /100 | #234 | Tragic 27.0% |
| Immigrants | Hungary | 4.8 /100 | #235 | Tragic 27.0% |
| Immigrants | Romania | 4.8 /100 | #236 | Tragic 27.0% |
| Immigrants | Eastern Asia | 4.4 /100 | #237 | Tragic 27.1% |
| Osage | 4.4 /100 | #238 | Tragic 27.1% |
| Estonians | 4.3 /100 | #239 | Tragic 27.1% |
| Immigrants | Europe | 3.8 /100 | #240 | Tragic 27.1% |
| Creek | 3.8 /100 | #241 | Tragic 27.1% |
| Immigrants | Sri Lanka | 3.7 /100 | #242 | Tragic 27.1% |
| Spanish | 3.6 /100 | #243 | Tragic 27.1% |
| Chickasaw | 3.5 /100 | #244 | Tragic 27.2% |
| Immigrants | Azores | 3.5 /100 | #245 | Tragic 27.2% |
| Immigrants | Nonimmigrants | 3.3 /100 | #246 | Tragic 27.2% |