Immigrants from Guatemala vs Immigrants from Lithuania Wage/Income Gap
COMPARE
Immigrants from Guatemala
Immigrants from Lithuania
Wage/Income Gap
Wage/Income Gap Comparison
Immigrants from Guatemala
Immigrants from Lithuania
22.5%
WAGE/INCOME GAP
100.0/ 100
METRIC RATING
62nd/ 347
METRIC RANK
28.6%
WAGE/INCOME GAP
0.1/ 100
METRIC RATING
311th/ 347
METRIC RANK
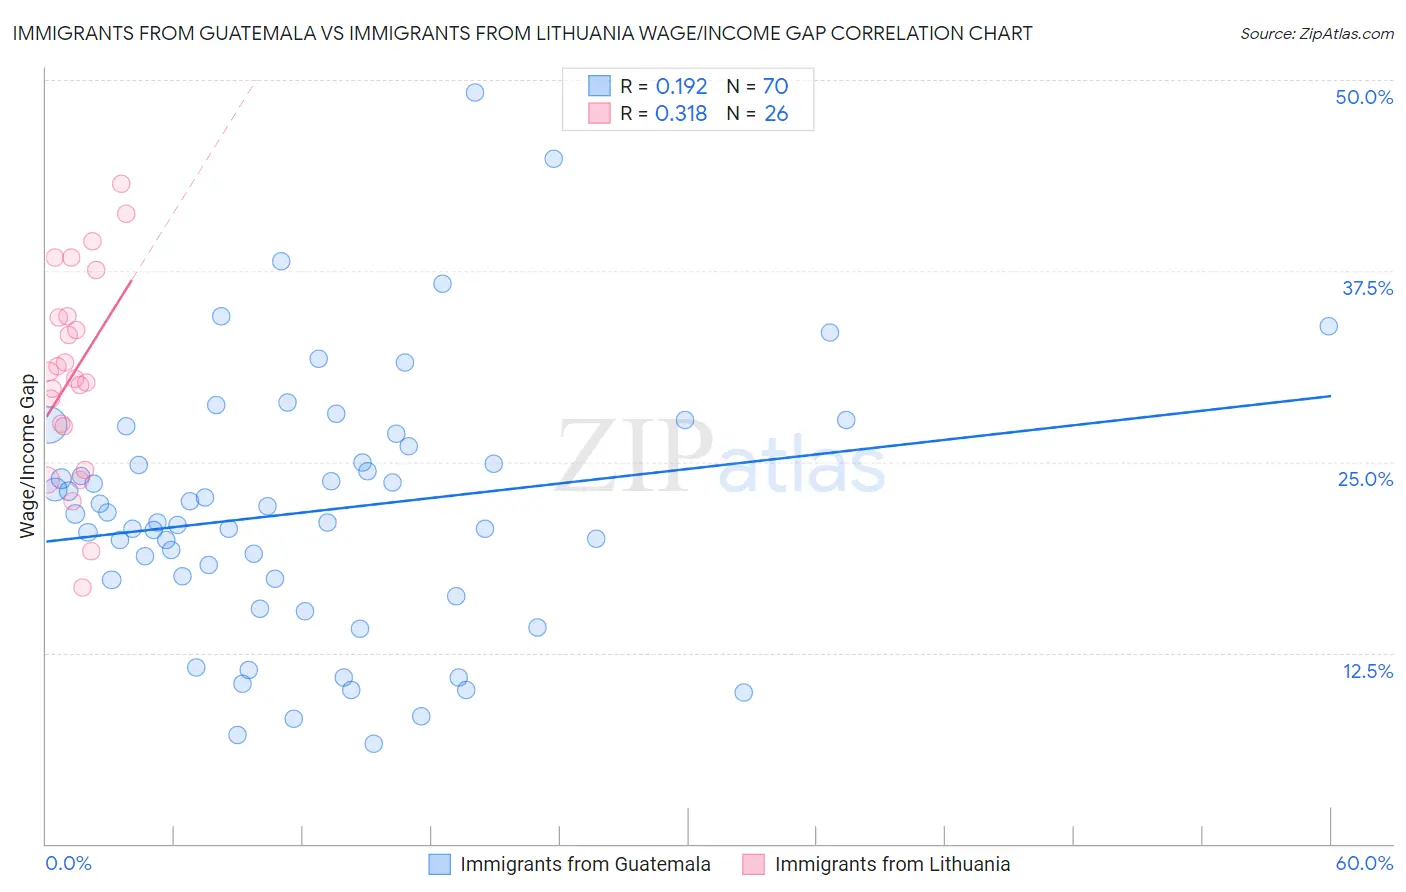
Immigrants from Guatemala vs Immigrants from Lithuania Wage/Income Gap Correlation Chart
The statistical analysis conducted on geographies consisting of 377,062,007 people shows a poor positive correlation between the proportion of Immigrants from Guatemala and wage/income gap percentage in the United States with a correlation coefficient (R) of 0.192 and weighted average of 22.5%. Similarly, the statistical analysis conducted on geographies consisting of 117,698,624 people shows a mild positive correlation between the proportion of Immigrants from Lithuania and wage/income gap percentage in the United States with a correlation coefficient (R) of 0.318 and weighted average of 28.6%, a difference of 27.4%.
Wage/Income Gap Correlation Summary
| Measurement | Immigrants from Guatemala | Immigrants from Lithuania |
| Minimum | 6.6% | 16.8% |
| Maximum | 49.2% | 43.2% |
| Range | 42.6% | 26.5% |
| Mean | 21.8% | 30.9% |
| Median | 21.3% | 30.7% |
| Interquartile 25% (IQ1) | 17.3% | 27.3% |
| Interquartile 75% (IQ3) | 26.1% | 34.5% |
| Interquartile Range (IQR) | 8.8% | 7.3% |
| Standard Deviation (Sample) | 8.5% | 6.7% |
| Standard Deviation (Population) | 8.4% | 6.5% |
Similar Demographics by Wage/Income Gap
Demographics Similar to Immigrants from Guatemala by Wage/Income Gap
In terms of wage/income gap, the demographic groups most similar to Immigrants from Guatemala are Immigrants from Ecuador (22.5%, a difference of 0.14%), Immigrants from Fiji (22.4%, a difference of 0.21%), Immigrants from Middle Africa (22.4%, a difference of 0.38%), Navajo (22.4%, a difference of 0.40%), and Spanish American Indian (22.5%, a difference of 0.43%).
| Demographics | Rating | Rank | Wage/Income Gap |
| Immigrants | Zaire | 100.0 /100 | #55 | Exceptional 22.3% |
| Immigrants | Ghana | 100.0 /100 | #56 | Exceptional 22.3% |
| Ghanaians | 100.0 /100 | #57 | Exceptional 22.3% |
| Immigrants | Cuba | 100.0 /100 | #58 | Exceptional 22.4% |
| Navajo | 100.0 /100 | #59 | Exceptional 22.4% |
| Immigrants | Middle Africa | 100.0 /100 | #60 | Exceptional 22.4% |
| Immigrants | Fiji | 100.0 /100 | #61 | Exceptional 22.4% |
| Immigrants | Guatemala | 100.0 /100 | #62 | Exceptional 22.5% |
| Immigrants | Ecuador | 100.0 /100 | #63 | Exceptional 22.5% |
| Spanish American Indians | 100.0 /100 | #64 | Exceptional 22.5% |
| Guatemalans | 99.9 /100 | #65 | Exceptional 22.6% |
| Central American Indians | 99.9 /100 | #66 | Exceptional 22.7% |
| Menominee | 99.9 /100 | #67 | Exceptional 22.7% |
| Immigrants | Nigeria | 99.9 /100 | #68 | Exceptional 22.7% |
| Indonesians | 99.9 /100 | #69 | Exceptional 22.7% |
Demographics Similar to Immigrants from Lithuania by Wage/Income Gap
In terms of wage/income gap, the demographic groups most similar to Immigrants from Lithuania are Finnish (28.6%, a difference of 0.070%), Eastern European (28.6%, a difference of 0.13%), Macedonian (28.6%, a difference of 0.16%), Polish (28.5%, a difference of 0.25%), and French (28.7%, a difference of 0.26%).
| Demographics | Rating | Rank | Wage/Income Gap |
| Immigrants | Netherlands | 0.2 /100 | #304 | Tragic 28.5% |
| Immigrants | South Africa | 0.1 /100 | #305 | Tragic 28.5% |
| Whites/Caucasians | 0.1 /100 | #306 | Tragic 28.5% |
| Immigrants | Denmark | 0.1 /100 | #307 | Tragic 28.5% |
| Poles | 0.1 /100 | #308 | Tragic 28.5% |
| Macedonians | 0.1 /100 | #309 | Tragic 28.6% |
| Finns | 0.1 /100 | #310 | Tragic 28.6% |
| Immigrants | Lithuania | 0.1 /100 | #311 | Tragic 28.6% |
| Eastern Europeans | 0.1 /100 | #312 | Tragic 28.6% |
| French | 0.1 /100 | #313 | Tragic 28.7% |
| Immigrants | Scotland | 0.1 /100 | #314 | Tragic 28.7% |
| Maltese | 0.1 /100 | #315 | Tragic 28.7% |
| Lithuanians | 0.1 /100 | #316 | Tragic 28.7% |
| Belgians | 0.1 /100 | #317 | Tragic 28.8% |
| Basques | 0.1 /100 | #318 | Tragic 28.8% |