Russian vs Immigrants from Lithuania Vision Disability
COMPARE
Russian
Immigrants from Lithuania
Vision Disability
Vision Disability Comparison
Russians
Immigrants from Lithuania
2.0%
VISION DISABILITY
98.6/ 100
METRIC RATING
69th/ 347
METRIC RANK
1.9%
VISION DISABILITY
99.9/ 100
METRIC RATING
24th/ 347
METRIC RANK
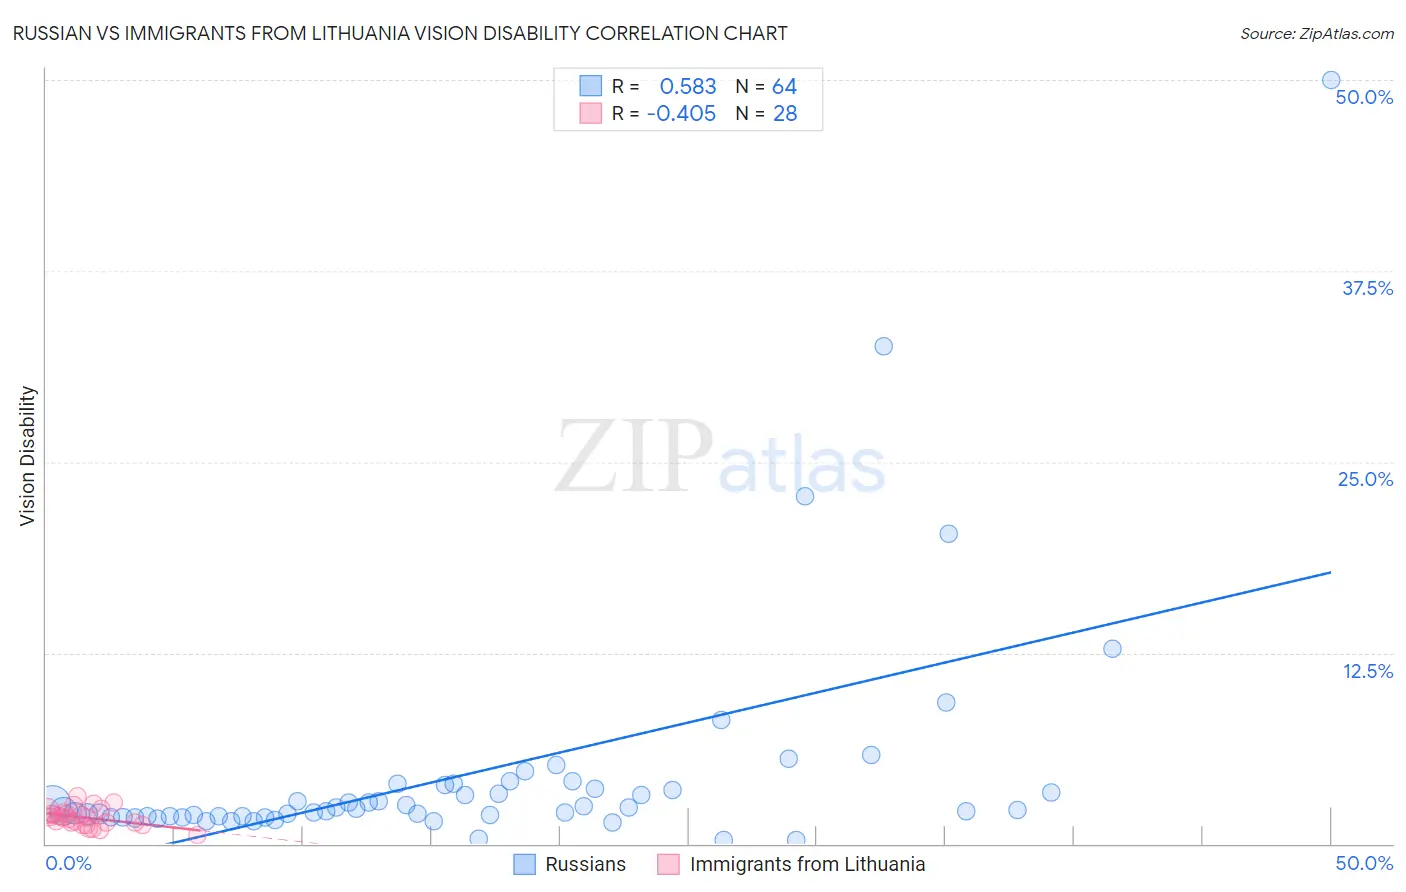
Russian vs Immigrants from Lithuania Vision Disability Correlation Chart
The statistical analysis conducted on geographies consisting of 511,148,193 people shows a substantial positive correlation between the proportion of Russians and percentage of population with vision disability in the United States with a correlation coefficient (R) of 0.583 and weighted average of 2.0%. Similarly, the statistical analysis conducted on geographies consisting of 117,709,578 people shows a moderate negative correlation between the proportion of Immigrants from Lithuania and percentage of population with vision disability in the United States with a correlation coefficient (R) of -0.405 and weighted average of 1.9%, a difference of 5.3%.
Vision Disability Correlation Summary
| Measurement | Russian | Immigrants from Lithuania |
| Minimum | 0.22% | 0.53% |
| Maximum | 50.0% | 3.1% |
| Range | 49.8% | 2.6% |
| Mean | 4.6% | 1.7% |
| Median | 2.2% | 1.7% |
| Interquartile 25% (IQ1) | 1.8% | 1.3% |
| Interquartile 75% (IQ3) | 3.7% | 2.0% |
| Interquartile Range (IQR) | 1.9% | 0.69% |
| Standard Deviation (Sample) | 7.8% | 0.59% |
| Standard Deviation (Population) | 7.8% | 0.58% |
Similar Demographics by Vision Disability
Demographics Similar to Russians by Vision Disability
In terms of vision disability, the demographic groups most similar to Russians are Immigrants from Kazakhstan (2.0%, a difference of 0.020%), Immigrants from Northern Europe (2.0%, a difference of 0.030%), Immigrants from France (2.0%, a difference of 0.080%), Immigrants from Czechoslovakia (2.0%, a difference of 0.17%), and Immigrants from Northern Africa (2.0%, a difference of 0.27%).
| Demographics | Rating | Rank | Vision Disability |
| Immigrants | Russia | 99.1 /100 | #62 | Exceptional 2.0% |
| Armenians | 99.0 /100 | #63 | Exceptional 2.0% |
| Immigrants | Greece | 99.0 /100 | #64 | Exceptional 2.0% |
| Maltese | 98.9 /100 | #65 | Exceptional 2.0% |
| Immigrants | Argentina | 98.9 /100 | #66 | Exceptional 2.0% |
| Immigrants | Northern Africa | 98.8 /100 | #67 | Exceptional 2.0% |
| Immigrants | Czechoslovakia | 98.7 /100 | #68 | Exceptional 2.0% |
| Russians | 98.6 /100 | #69 | Exceptional 2.0% |
| Immigrants | Kazakhstan | 98.6 /100 | #70 | Exceptional 2.0% |
| Immigrants | Northern Europe | 98.6 /100 | #71 | Exceptional 2.0% |
| Immigrants | France | 98.5 /100 | #72 | Exceptional 2.0% |
| Immigrants | Eritrea | 98.4 /100 | #73 | Exceptional 2.0% |
| Palestinians | 98.3 /100 | #74 | Exceptional 2.0% |
| Immigrants | North Macedonia | 98.3 /100 | #75 | Exceptional 2.0% |
| Paraguayans | 98.3 /100 | #76 | Exceptional 2.0% |
Demographics Similar to Immigrants from Lithuania by Vision Disability
In terms of vision disability, the demographic groups most similar to Immigrants from Lithuania are Bulgarian (1.9%, a difference of 0.040%), Immigrants from Japan (1.9%, a difference of 0.080%), Immigrants from Asia (1.9%, a difference of 0.12%), Taiwanese (1.9%, a difference of 0.41%), and Immigrants from Malaysia (1.9%, a difference of 0.44%).
| Demographics | Rating | Rank | Vision Disability |
| Burmese | 100.0 /100 | #17 | Exceptional 1.8% |
| Bolivians | 100.0 /100 | #18 | Exceptional 1.9% |
| Immigrants | Sri Lanka | 100.0 /100 | #19 | Exceptional 1.9% |
| Asians | 100.0 /100 | #20 | Exceptional 1.9% |
| Turks | 100.0 /100 | #21 | Exceptional 1.9% |
| Immigrants | Pakistan | 100.0 /100 | #22 | Exceptional 1.9% |
| Immigrants | Asia | 99.9 /100 | #23 | Exceptional 1.9% |
| Immigrants | Lithuania | 99.9 /100 | #24 | Exceptional 1.9% |
| Bulgarians | 99.9 /100 | #25 | Exceptional 1.9% |
| Immigrants | Japan | 99.9 /100 | #26 | Exceptional 1.9% |
| Taiwanese | 99.9 /100 | #27 | Exceptional 1.9% |
| Immigrants | Malaysia | 99.9 /100 | #28 | Exceptional 1.9% |
| Egyptians | 99.9 /100 | #29 | Exceptional 1.9% |
| Immigrants | Nepal | 99.9 /100 | #30 | Exceptional 1.9% |
| Mongolians | 99.9 /100 | #31 | Exceptional 1.9% |