Romanian vs Lithuanian Median Family Income
COMPARE
Romanian
Lithuanian
Median Family Income
Median Family Income Comparison
Romanians
Lithuanians
$111,243
MEDIAN FAMILY INCOME
98.8/ 100
METRIC RATING
88th/ 347
METRIC RANK
$115,395
MEDIAN FAMILY INCOME
99.8/ 100
METRIC RATING
55th/ 347
METRIC RANK
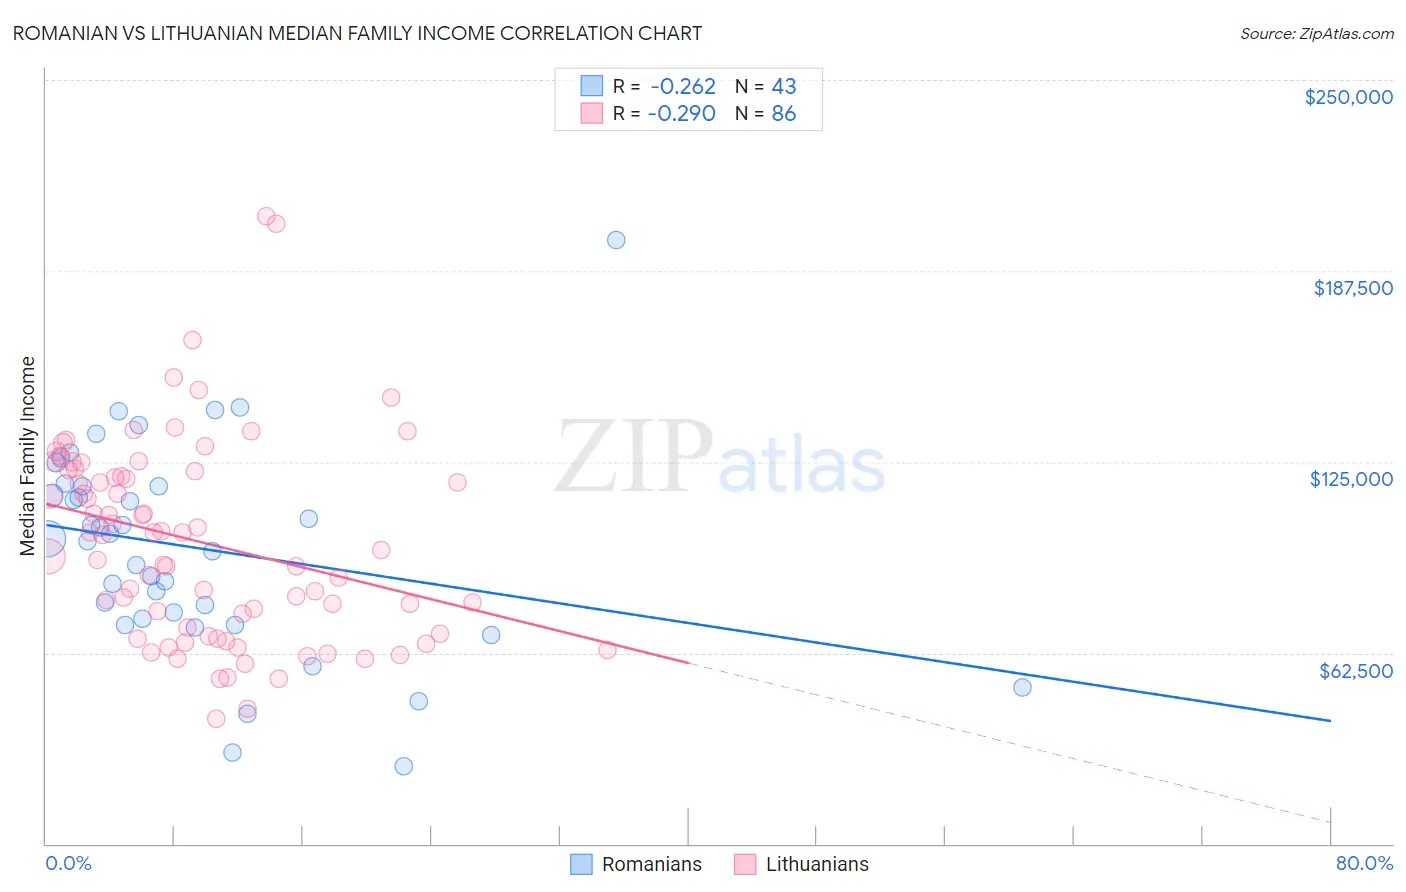
Romanian vs Lithuanian Median Family Income Correlation Chart
The statistical analysis conducted on geographies consisting of 377,611,628 people shows a weak negative correlation between the proportion of Romanians and median family income in the United States with a correlation coefficient (R) of -0.262 and weighted average of $111,243. Similarly, the statistical analysis conducted on geographies consisting of 421,580,466 people shows a weak negative correlation between the proportion of Lithuanians and median family income in the United States with a correlation coefficient (R) of -0.290 and weighted average of $115,395, a difference of 3.7%.
Median Family Income Correlation Summary
| Measurement | Romanian | Lithuanian |
| Minimum | $25,417 | $40,809 |
| Maximum | $197,500 | $205,368 |
| Range | $172,083 | $164,559 |
| Mean | $96,934 | $98,726 |
| Median | $100,017 | $98,683 |
| Interquartile 25% (IQ1) | $73,551 | $68,538 |
| Interquartile 75% (IQ3) | $117,024 | $122,072 |
| Interquartile Range (IQR) | $43,473 | $53,534 |
| Standard Deviation (Sample) | $33,876 | $32,784 |
| Standard Deviation (Population) | $33,480 | $32,593 |
Similar Demographics by Median Family Income
Demographics Similar to Romanians by Median Family Income
In terms of median family income, the demographic groups most similar to Romanians are Austrian ($111,306, a difference of 0.060%), Croatian ($111,370, a difference of 0.11%), Ukrainian ($111,368, a difference of 0.11%), Immigrants from Hungary ($111,378, a difference of 0.12%), and Immigrants from Argentina ($110,873, a difference of 0.33%).
| Demographics | Rating | Rank | Median Family Income |
| Immigrants | North America | 99.2 /100 | #81 | Exceptional $112,151 |
| Immigrants | England | 99.2 /100 | #82 | Exceptional $112,038 |
| Immigrants | Egypt | 99.0 /100 | #83 | Exceptional $111,689 |
| Immigrants | Hungary | 98.8 /100 | #84 | Exceptional $111,378 |
| Croatians | 98.8 /100 | #85 | Exceptional $111,370 |
| Ukrainians | 98.8 /100 | #86 | Exceptional $111,368 |
| Austrians | 98.8 /100 | #87 | Exceptional $111,306 |
| Romanians | 98.8 /100 | #88 | Exceptional $111,243 |
| Immigrants | Argentina | 98.5 /100 | #89 | Exceptional $110,873 |
| Northern Europeans | 98.3 /100 | #90 | Exceptional $110,635 |
| Immigrants | Southern Europe | 98.3 /100 | #91 | Exceptional $110,614 |
| Immigrants | Lebanon | 97.9 /100 | #92 | Exceptional $110,159 |
| Immigrants | Kazakhstan | 97.8 /100 | #93 | Exceptional $110,137 |
| Koreans | 97.8 /100 | #94 | Exceptional $110,103 |
| Zimbabweans | 97.7 /100 | #95 | Exceptional $110,011 |
Demographics Similar to Lithuanians by Median Family Income
In terms of median family income, the demographic groups most similar to Lithuanians are Immigrants from Europe ($115,523, a difference of 0.11%), New Zealander ($115,230, a difference of 0.14%), Greek ($115,192, a difference of 0.18%), Immigrants from Indonesia ($115,162, a difference of 0.20%), and Immigrants from Netherlands ($114,987, a difference of 0.35%).
| Demographics | Rating | Rank | Median Family Income |
| Immigrants | South Africa | 99.9 /100 | #48 | Exceptional $116,286 |
| Chinese | 99.9 /100 | #49 | Exceptional $116,188 |
| Immigrants | Czechoslovakia | 99.9 /100 | #50 | Exceptional $116,165 |
| Immigrants | Malaysia | 99.9 /100 | #51 | Exceptional $115,880 |
| Maltese | 99.9 /100 | #52 | Exceptional $115,862 |
| Immigrants | Norway | 99.9 /100 | #53 | Exceptional $115,847 |
| Immigrants | Europe | 99.9 /100 | #54 | Exceptional $115,523 |
| Lithuanians | 99.8 /100 | #55 | Exceptional $115,395 |
| New Zealanders | 99.8 /100 | #56 | Exceptional $115,230 |
| Greeks | 99.8 /100 | #57 | Exceptional $115,192 |
| Immigrants | Indonesia | 99.8 /100 | #58 | Exceptional $115,162 |
| Immigrants | Netherlands | 99.8 /100 | #59 | Exceptional $114,987 |
| Immigrants | Latvia | 99.8 /100 | #60 | Exceptional $114,826 |
| Immigrants | Belarus | 99.8 /100 | #61 | Exceptional $114,586 |
| Mongolians | 99.8 /100 | #62 | Exceptional $114,553 |