Romanian vs Lithuanian Male Poverty
COMPARE
Romanian
Lithuanian
Male Poverty
Male Poverty Comparison
Romanians
Lithuanians
10.5%
MALE POVERTY
93.6/ 100
METRIC RATING
97th/ 347
METRIC RANK
9.5%
MALE POVERTY
99.8/ 100
METRIC RATING
18th/ 347
METRIC RANK
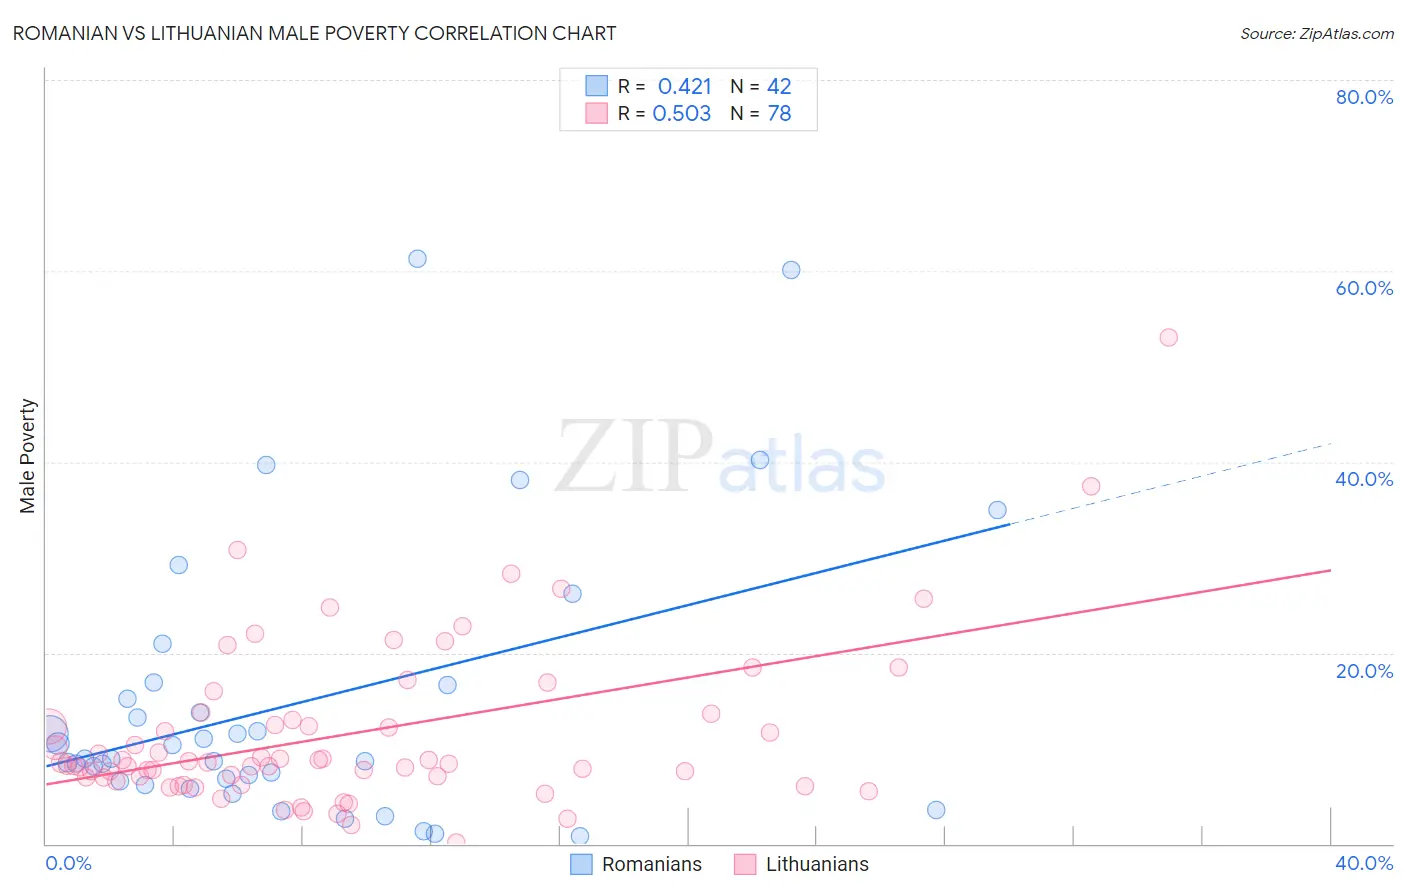
Romanian vs Lithuanian Male Poverty Correlation Chart
The statistical analysis conducted on geographies consisting of 377,566,833 people shows a moderate positive correlation between the proportion of Romanians and poverty level among males in the United States with a correlation coefficient (R) of 0.421 and weighted average of 10.5%. Similarly, the statistical analysis conducted on geographies consisting of 421,480,494 people shows a substantial positive correlation between the proportion of Lithuanians and poverty level among males in the United States with a correlation coefficient (R) of 0.503 and weighted average of 9.5%, a difference of 9.6%.
Male Poverty Correlation Summary
| Measurement | Romanian | Lithuanian |
| Minimum | 0.81% | 0.15% |
| Maximum | 61.3% | 53.0% |
| Range | 60.5% | 52.8% |
| Mean | 14.8% | 11.4% |
| Median | 8.9% | 8.5% |
| Interquartile 25% (IQ1) | 6.5% | 6.9% |
| Interquartile 75% (IQ3) | 16.6% | 13.0% |
| Interquartile Range (IQR) | 10.1% | 6.0% |
| Standard Deviation (Sample) | 14.7% | 8.6% |
| Standard Deviation (Population) | 14.5% | 8.6% |
Similar Demographics by Male Poverty
Demographics Similar to Romanians by Male Poverty
In terms of male poverty, the demographic groups most similar to Romanians are Immigrants from Egypt (10.4%, a difference of 0.050%), Finnish (10.5%, a difference of 0.060%), Immigrants from Indonesia (10.5%, a difference of 0.13%), Scottish (10.4%, a difference of 0.18%), and Immigrants from South Africa (10.4%, a difference of 0.22%).
| Demographics | Rating | Rank | Male Poverty |
| Indians (Asian) | 94.9 /100 | #90 | Exceptional 10.4% |
| British | 94.8 /100 | #91 | Exceptional 10.4% |
| Jordanians | 94.4 /100 | #92 | Exceptional 10.4% |
| Australians | 94.4 /100 | #93 | Exceptional 10.4% |
| Immigrants | South Africa | 94.1 /100 | #94 | Exceptional 10.4% |
| Scottish | 94.0 /100 | #95 | Exceptional 10.4% |
| Immigrants | Egypt | 93.7 /100 | #96 | Exceptional 10.4% |
| Romanians | 93.6 /100 | #97 | Exceptional 10.5% |
| Finns | 93.4 /100 | #98 | Exceptional 10.5% |
| Immigrants | Indonesia | 93.3 /100 | #99 | Exceptional 10.5% |
| Immigrants | Latvia | 92.8 /100 | #100 | Exceptional 10.5% |
| Immigrants | Zimbabwe | 92.0 /100 | #101 | Exceptional 10.5% |
| French Canadians | 91.9 /100 | #102 | Exceptional 10.5% |
| Slavs | 91.7 /100 | #103 | Exceptional 10.5% |
| Welsh | 91.6 /100 | #104 | Exceptional 10.5% |
Demographics Similar to Lithuanians by Male Poverty
In terms of male poverty, the demographic groups most similar to Lithuanians are Norwegian (9.5%, a difference of 0.17%), Immigrants from Hong Kong (9.6%, a difference of 0.18%), Latvian (9.6%, a difference of 0.28%), Luxembourger (9.5%, a difference of 0.30%), and Immigrants from Scotland (9.6%, a difference of 0.55%).
| Demographics | Rating | Rank | Male Poverty |
| Bolivians | 99.9 /100 | #11 | Exceptional 9.4% |
| Immigrants | Bolivia | 99.9 /100 | #12 | Exceptional 9.4% |
| Immigrants | Lithuania | 99.9 /100 | #13 | Exceptional 9.4% |
| Immigrants | North Macedonia | 99.8 /100 | #14 | Exceptional 9.4% |
| Bhutanese | 99.8 /100 | #15 | Exceptional 9.5% |
| Luxembourgers | 99.8 /100 | #16 | Exceptional 9.5% |
| Norwegians | 99.8 /100 | #17 | Exceptional 9.5% |
| Lithuanians | 99.8 /100 | #18 | Exceptional 9.5% |
| Immigrants | Hong Kong | 99.7 /100 | #19 | Exceptional 9.6% |
| Latvians | 99.7 /100 | #20 | Exceptional 9.6% |
| Immigrants | Scotland | 99.7 /100 | #21 | Exceptional 9.6% |
| Croatians | 99.7 /100 | #22 | Exceptional 9.6% |
| Italians | 99.7 /100 | #23 | Exceptional 9.6% |
| Swedes | 99.7 /100 | #24 | Exceptional 9.6% |
| Eastern Europeans | 99.6 /100 | #25 | Exceptional 9.6% |