Immigrants from Liberia vs Lithuanian Median Family Income
COMPARE
Immigrants from Liberia
Lithuanian
Median Family Income
Median Family Income Comparison
Immigrants from Liberia
Lithuanians
$90,450
MEDIAN FAMILY INCOME
0.2/ 100
METRIC RATING
272nd/ 347
METRIC RANK
$115,395
MEDIAN FAMILY INCOME
99.8/ 100
METRIC RATING
55th/ 347
METRIC RANK
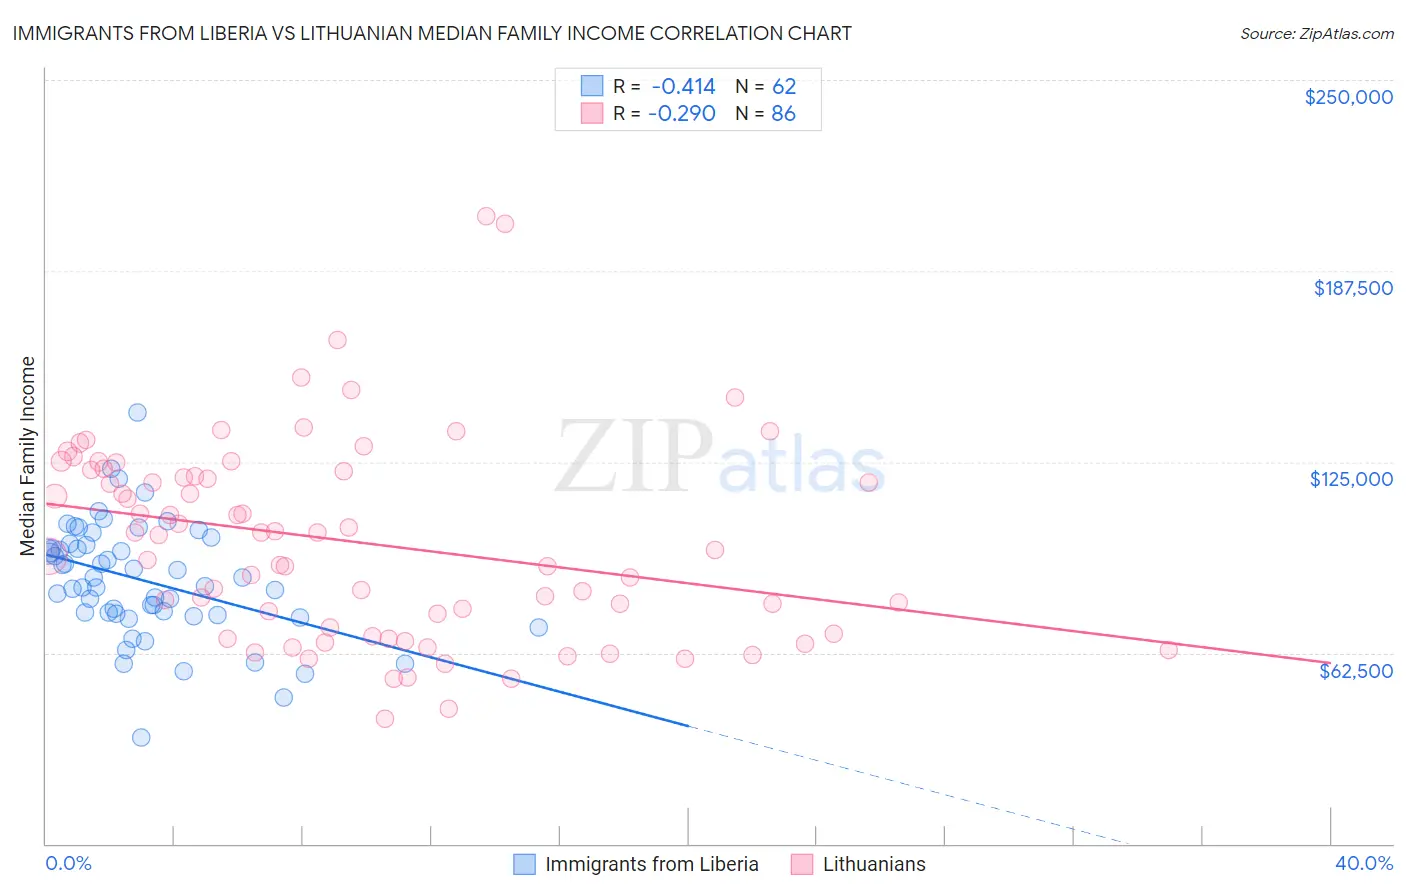
Immigrants from Liberia vs Lithuanian Median Family Income Correlation Chart
The statistical analysis conducted on geographies consisting of 135,228,267 people shows a moderate negative correlation between the proportion of Immigrants from Liberia and median family income in the United States with a correlation coefficient (R) of -0.414 and weighted average of $90,450. Similarly, the statistical analysis conducted on geographies consisting of 421,580,466 people shows a weak negative correlation between the proportion of Lithuanians and median family income in the United States with a correlation coefficient (R) of -0.290 and weighted average of $115,395, a difference of 27.6%.
Median Family Income Correlation Summary
| Measurement | Immigrants from Liberia | Lithuanian |
| Minimum | $34,978 | $40,809 |
| Maximum | $141,080 | $205,368 |
| Range | $106,102 | $164,559 |
| Mean | $86,151 | $98,726 |
| Median | $85,817 | $98,683 |
| Interquartile 25% (IQ1) | $75,284 | $68,538 |
| Interquartile 75% (IQ3) | $97,769 | $122,072 |
| Interquartile Range (IQR) | $22,485 | $53,534 |
| Standard Deviation (Sample) | $18,837 | $32,784 |
| Standard Deviation (Population) | $18,685 | $32,593 |
Similar Demographics by Median Family Income
Demographics Similar to Immigrants from Liberia by Median Family Income
In terms of median family income, the demographic groups most similar to Immigrants from Liberia are Iroquois ($90,543, a difference of 0.10%), Immigrants from Micronesia ($90,345, a difference of 0.12%), Jamaican ($90,581, a difference of 0.14%), Spanish American ($90,322, a difference of 0.14%), and Immigrants from St. Vincent and the Grenadines ($90,094, a difference of 0.40%).
| Demographics | Rating | Rank | Median Family Income |
| Hmong | 0.3 /100 | #265 | Tragic $91,296 |
| Central Americans | 0.3 /100 | #266 | Tragic $91,087 |
| Mexican American Indians | 0.2 /100 | #267 | Tragic $90,918 |
| Cree | 0.2 /100 | #268 | Tragic $90,882 |
| Belizeans | 0.2 /100 | #269 | Tragic $90,880 |
| Jamaicans | 0.2 /100 | #270 | Tragic $90,581 |
| Iroquois | 0.2 /100 | #271 | Tragic $90,543 |
| Immigrants | Liberia | 0.2 /100 | #272 | Tragic $90,450 |
| Immigrants | Micronesia | 0.2 /100 | #273 | Tragic $90,345 |
| Spanish Americans | 0.2 /100 | #274 | Tragic $90,322 |
| Immigrants | St. Vincent and the Grenadines | 0.2 /100 | #275 | Tragic $90,094 |
| Immigrants | Zaire | 0.1 /100 | #276 | Tragic $89,285 |
| Immigrants | Jamaica | 0.1 /100 | #277 | Tragic $89,268 |
| Immigrants | Grenada | 0.1 /100 | #278 | Tragic $89,249 |
| Immigrants | Belize | 0.1 /100 | #279 | Tragic $89,197 |
Demographics Similar to Lithuanians by Median Family Income
In terms of median family income, the demographic groups most similar to Lithuanians are Immigrants from Europe ($115,523, a difference of 0.11%), New Zealander ($115,230, a difference of 0.14%), Greek ($115,192, a difference of 0.18%), Immigrants from Indonesia ($115,162, a difference of 0.20%), and Immigrants from Netherlands ($114,987, a difference of 0.35%).
| Demographics | Rating | Rank | Median Family Income |
| Immigrants | South Africa | 99.9 /100 | #48 | Exceptional $116,286 |
| Chinese | 99.9 /100 | #49 | Exceptional $116,188 |
| Immigrants | Czechoslovakia | 99.9 /100 | #50 | Exceptional $116,165 |
| Immigrants | Malaysia | 99.9 /100 | #51 | Exceptional $115,880 |
| Maltese | 99.9 /100 | #52 | Exceptional $115,862 |
| Immigrants | Norway | 99.9 /100 | #53 | Exceptional $115,847 |
| Immigrants | Europe | 99.9 /100 | #54 | Exceptional $115,523 |
| Lithuanians | 99.8 /100 | #55 | Exceptional $115,395 |
| New Zealanders | 99.8 /100 | #56 | Exceptional $115,230 |
| Greeks | 99.8 /100 | #57 | Exceptional $115,192 |
| Immigrants | Indonesia | 99.8 /100 | #58 | Exceptional $115,162 |
| Immigrants | Netherlands | 99.8 /100 | #59 | Exceptional $114,987 |
| Immigrants | Latvia | 99.8 /100 | #60 | Exceptional $114,826 |
| Immigrants | Belarus | 99.8 /100 | #61 | Exceptional $114,586 |
| Mongolians | 99.8 /100 | #62 | Exceptional $114,553 |