Dominican vs Lithuanian Median Family Income
COMPARE
Dominican
Lithuanian
Median Family Income
Median Family Income Comparison
Dominicans
Lithuanians
$82,888
MEDIAN FAMILY INCOME
0.0/ 100
METRIC RATING
322nd/ 347
METRIC RANK
$115,395
MEDIAN FAMILY INCOME
99.8/ 100
METRIC RATING
55th/ 347
METRIC RANK
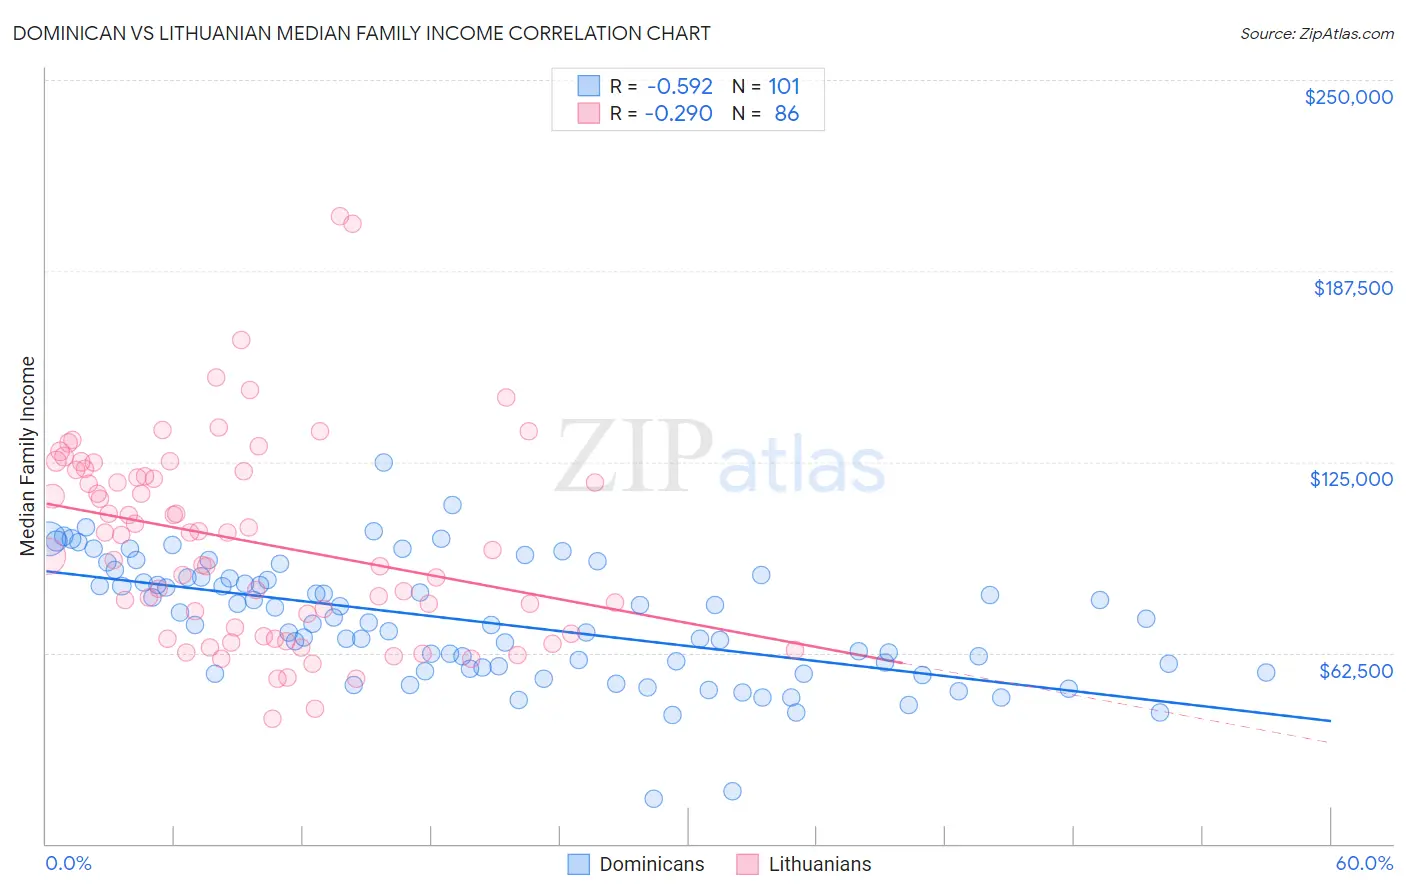
Dominican vs Lithuanian Median Family Income Correlation Chart
The statistical analysis conducted on geographies consisting of 354,580,571 people shows a substantial negative correlation between the proportion of Dominicans and median family income in the United States with a correlation coefficient (R) of -0.592 and weighted average of $82,888. Similarly, the statistical analysis conducted on geographies consisting of 421,580,466 people shows a weak negative correlation between the proportion of Lithuanians and median family income in the United States with a correlation coefficient (R) of -0.290 and weighted average of $115,395, a difference of 39.2%.
Median Family Income Correlation Summary
| Measurement | Dominican | Lithuanian |
| Minimum | $14,766 | $40,809 |
| Maximum | $124,734 | $205,368 |
| Range | $109,968 | $164,559 |
| Mean | $72,735 | $98,726 |
| Median | $72,364 | $98,683 |
| Interquartile 25% (IQ1) | $57,406 | $68,538 |
| Interquartile 75% (IQ3) | $87,079 | $122,072 |
| Interquartile Range (IQR) | $29,673 | $53,534 |
| Standard Deviation (Sample) | $19,775 | $32,784 |
| Standard Deviation (Population) | $19,677 | $32,593 |
Similar Demographics by Median Family Income
Demographics Similar to Dominicans by Median Family Income
In terms of median family income, the demographic groups most similar to Dominicans are Bahamian ($82,631, a difference of 0.31%), Creek ($82,560, a difference of 0.40%), Immigrants from Caribbean ($83,319, a difference of 0.52%), Seminole ($83,354, a difference of 0.56%), and Sioux ($82,386, a difference of 0.61%).
| Demographics | Rating | Rank | Median Family Income |
| Apache | 0.0 /100 | #315 | Tragic $84,451 |
| Immigrants | Haiti | 0.0 /100 | #316 | Tragic $84,018 |
| Yakama | 0.0 /100 | #317 | Tragic $83,932 |
| Immigrants | Mexico | 0.0 /100 | #318 | Tragic $83,639 |
| Immigrants | Honduras | 0.0 /100 | #319 | Tragic $83,618 |
| Seminole | 0.0 /100 | #320 | Tragic $83,354 |
| Immigrants | Caribbean | 0.0 /100 | #321 | Tragic $83,319 |
| Dominicans | 0.0 /100 | #322 | Tragic $82,888 |
| Bahamians | 0.0 /100 | #323 | Tragic $82,631 |
| Creek | 0.0 /100 | #324 | Tragic $82,560 |
| Sioux | 0.0 /100 | #325 | Tragic $82,386 |
| Immigrants | Congo | 0.0 /100 | #326 | Tragic $82,216 |
| Arapaho | 0.0 /100 | #327 | Tragic $82,064 |
| Blacks/African Americans | 0.0 /100 | #328 | Tragic $81,912 |
| Dutch West Indians | 0.0 /100 | #329 | Tragic $81,852 |
Demographics Similar to Lithuanians by Median Family Income
In terms of median family income, the demographic groups most similar to Lithuanians are Immigrants from Europe ($115,523, a difference of 0.11%), New Zealander ($115,230, a difference of 0.14%), Greek ($115,192, a difference of 0.18%), Immigrants from Indonesia ($115,162, a difference of 0.20%), and Immigrants from Netherlands ($114,987, a difference of 0.35%).
| Demographics | Rating | Rank | Median Family Income |
| Immigrants | South Africa | 99.9 /100 | #48 | Exceptional $116,286 |
| Chinese | 99.9 /100 | #49 | Exceptional $116,188 |
| Immigrants | Czechoslovakia | 99.9 /100 | #50 | Exceptional $116,165 |
| Immigrants | Malaysia | 99.9 /100 | #51 | Exceptional $115,880 |
| Maltese | 99.9 /100 | #52 | Exceptional $115,862 |
| Immigrants | Norway | 99.9 /100 | #53 | Exceptional $115,847 |
| Immigrants | Europe | 99.9 /100 | #54 | Exceptional $115,523 |
| Lithuanians | 99.8 /100 | #55 | Exceptional $115,395 |
| New Zealanders | 99.8 /100 | #56 | Exceptional $115,230 |
| Greeks | 99.8 /100 | #57 | Exceptional $115,192 |
| Immigrants | Indonesia | 99.8 /100 | #58 | Exceptional $115,162 |
| Immigrants | Netherlands | 99.8 /100 | #59 | Exceptional $114,987 |
| Immigrants | Latvia | 99.8 /100 | #60 | Exceptional $114,826 |
| Immigrants | Belarus | 99.8 /100 | #61 | Exceptional $114,586 |
| Mongolians | 99.8 /100 | #62 | Exceptional $114,553 |