Romanian vs Immigrants from Bulgaria Median Family Income

COMPARE

Romanian
Race
Ancestry
AfghanAfricanAlaska NativeAlaskan AthabascanAlbanianAleutAlsatianAmericanApacheArabArapahoArgentineanArmenianAssyrian/Chaldean/SyriacAustralianAustrianBahamianBangladeshiBarbadianBasqueBelgianBelizeanBermudanBhutaneseBlackfeetBolivianBrazilianBritishBritish West IndianBulgarianBurmeseCajunCambodianCanadianCape VerdeanCarpatho RusynCelticCentral AmericanCentral American IndianCherokeeCheyenneChickasawChileanChineseChippewaChoctawColombianColvilleComancheCosta RicanCreeCreekCroatianCrowCubanCypriotCzechCzechoslovakianDanishDelawareDominicanDutchDutch West IndianEastern EuropeanEcuadorianEgyptianEnglishEstonianEthiopianEuropeanFijianFilipinoFinnishFrenchFrench American IndianFrench CanadianGermanGerman RussianGhanaianGreekGuamanian/ChamorroGuatemalanGuyaneseHaitianHmongHonduranHopiHoumaHungarianIcelanderIndian (Asian)IndonesianInupiatIranianIraqiIrishIroquoisIsraeliItalianJamaicanJapaneseJordanianKenyanKiowaKoreanLaotianLatvianLebaneseLiberianLithuanianLumbeeLuxembourgerMacedonianMalaysianMalteseMarshalleseMenomineeMexicanMexican American IndianMongolianMoroccanNative HawaiianNavajoNepaleseNew ZealanderNicaraguanNigerianNorthern EuropeanNorwegianOkinawanOsageOttawaPaiutePakistaniPalestinianPanamanianParaguayanPennsylvania GermanPeruvianPimaPolishPortuguesePotawatomiPuebloPuerto RicanPuget Sound SalishRomanianRussianSalvadoranSamoanScandinavianScotch-IrishScottishSeminoleSenegaleseSerbianShoshoneSierra LeoneanSiouxSlavicSlovakSloveneSomaliSouth AfricanSouth AmericanSouth American IndianSoviet UnionSpaniardSpanishSpanish AmericanSpanish American IndianSri LankanSubsaharan AfricanSudaneseSwedishSwissSyrianTaiwaneseThaiTlingit-HaidaTohono O'OdhamTonganTrinidadian and TobagonianTsimshianTurkishU.S. Virgin IslanderUgandanUkrainianUruguayanUteVenezuelanVietnameseWelshWest IndianYakamaYaquiYugoslavianYumanYup'ikZimbabwean
Immigration
NonimmigrantsImmigrantsAfghanistanAfricaAlbaniaArgentinaArmeniaAsiaAustraliaAustriaBahamasBangladeshBarbadosBelarusBelgiumBelizeBoliviaBosnia and HerzegovinaBrazilBurma/MyanmarCabo VerdeCambodiaCameroonCanadaCaribbeanCentral AmericaChileChinaColombiaCongoCosta RicaCroatiaCubaCzechoslovakiaDenmarkDominicaDominican RepublicEastern AfricaEastern AsiaEastern EuropeEcuadorEgyptEl SalvadorEnglandEritreaEthiopiaEuropeFijiFranceGermanyGhanaGreeceGrenadaGuatemalaGuyanaHaitiHondurasHong KongHungaryIndiaIndonesiaIranIraqIrelandIsraelItalyJamaicaJapanJordanKazakhstanKenyaKoreaKuwaitLaosLatin AmericaLatviaLebanonLiberiaLithuaniaMalaysiaMexicoMicronesiaMiddle AfricaMoldovaMoroccoNepalNetherlandsNicaraguaNigeriaNorth AmericaNorth MacedoniaNorthern AfricaNorthern EuropeNorwayOceaniaPakistanPanamaPeruPhilippinesPolandPortugalRomaniaRussiaSaudi ArabiaScotlandSenegalSerbiaSierra LeoneSingaporeSomaliaSouth AfricaSouth AmericaSouth Central AsiaSouth Eastern AsiaSouthern EuropeSpainSri LankaSt. Vincent and the GrenadinesSudanSwedenSwitzerlandSyriaTaiwanThailandTrinidad and TobagoTurkeyUgandaUkraineUruguayUzbekistanVenezuelaVietnamWest IndiesWestern AfricaWestern AsiaWestern EuropeYemenZaireZimbabweAzores
Immigrants from Bulgaria
Race
Ancestry
AfghanAfricanAlaska NativeAlaskan AthabascanAlbanianAleutAlsatianAmericanApacheArabArapahoArgentineanArmenianAssyrian/Chaldean/SyriacAustralianAustrianBahamianBangladeshiBarbadianBasqueBelgianBelizeanBermudanBhutaneseBlackfeetBolivianBrazilianBritishBritish West IndianBulgarianBurmeseCajunCambodianCanadianCape VerdeanCarpatho RusynCelticCentral AmericanCentral American IndianCherokeeCheyenneChickasawChileanChineseChippewaChoctawColombianColvilleComancheCosta RicanCreeCreekCroatianCrowCubanCypriotCzechCzechoslovakianDanishDelawareDominicanDutchDutch West IndianEastern EuropeanEcuadorianEgyptianEnglishEstonianEthiopianEuropeanFijianFilipinoFinnishFrenchFrench American IndianFrench CanadianGermanGerman RussianGhanaianGreekGuamanian/ChamorroGuatemalanGuyaneseHaitianHmongHonduranHopiHoumaHungarianIcelanderIndian (Asian)IndonesianInupiatIranianIraqiIrishIroquoisIsraeliItalianJamaicanJapaneseJordanianKenyanKiowaKoreanLaotianLatvianLebaneseLiberianLithuanianLumbeeLuxembourgerMacedonianMalaysianMalteseMarshalleseMenomineeMexicanMexican American IndianMongolianMoroccanNative HawaiianNavajoNepaleseNew ZealanderNicaraguanNigerianNorthern EuropeanNorwegianOkinawanOsageOttawaPaiutePakistaniPalestinianPanamanianParaguayanPennsylvania GermanPeruvianPimaPolishPortuguesePotawatomiPuebloPuerto RicanPuget Sound SalishRussianSalvadoranSamoanScandinavianScotch-IrishScottishSeminoleSenegaleseSerbianShoshoneSierra LeoneanSiouxSlavicSlovakSloveneSomaliSouth AfricanSouth AmericanSouth American IndianSoviet UnionSpaniardSpanishSpanish AmericanSpanish American IndianSri LankanSubsaharan AfricanSudaneseSwedishSwissSyrianTaiwaneseThaiTlingit-HaidaTohono O'OdhamTonganTrinidadian and TobagonianTsimshianTurkishU.S. Virgin IslanderUgandanUkrainianUruguayanUteVenezuelanVietnameseWelshWest IndianYakamaYaquiYugoslavianYumanYup'ikZimbabwean
Immigration
NonimmigrantsImmigrantsAfghanistanAfricaAlbaniaArgentinaArmeniaAsiaAustraliaAustriaBahamasBangladeshBarbadosBelarusBelgiumBelizeBoliviaBosnia and HerzegovinaBrazilBulgariaBurma/MyanmarCabo VerdeCambodiaCameroonCanadaCaribbeanCentral AmericaChileChinaColombiaCongoCosta RicaCroatiaCubaCzechoslovakiaDenmarkDominicaDominican RepublicEastern AfricaEastern AsiaEastern EuropeEcuadorEgyptEl SalvadorEnglandEritreaEthiopiaEuropeFijiFranceGermanyGhanaGreeceGrenadaGuatemalaGuyanaHaitiHondurasHong KongHungaryIndiaIndonesiaIranIraqIrelandIsraelItalyJamaicaJapanJordanKazakhstanKenyaKoreaKuwaitLaosLatin AmericaLatviaLebanonLiberiaLithuaniaMalaysiaMexicoMicronesiaMiddle AfricaMoldovaMoroccoNepalNetherlandsNicaraguaNigeriaNorth AmericaNorth MacedoniaNorthern AfricaNorthern EuropeNorwayOceaniaPakistanPanamaPeruPhilippinesPolandPortugalRomaniaRussiaSaudi ArabiaScotlandSenegalSerbiaSierra LeoneSingaporeSomaliaSouth AfricaSouth AmericaSouth Central AsiaSouth Eastern AsiaSouthern EuropeSpainSri LankaSt. Vincent and the GrenadinesSudanSwedenSwitzerlandSyriaTaiwanThailandTrinidad and TobagoTurkeyUgandaUkraineUruguayUzbekistanVenezuelaVietnamWest IndiesWestern AfricaWestern AsiaWestern EuropeYemenZaireZimbabweAzores
Median Family Income
Income
Poverty
Unemployment
Labor Participation
Family Structure
Vehicle Availability
Education Level
Disability

Median Family Income Comparison

Romanians

Immigrants from Bulgaria

Exceptional
Exceptional
$111,243
MEDIAN FAMILY INCOME
98.8/ 100
METRIC RATING
88th/ 347
METRIC RANK
$113,461
MEDIAN FAMILY INCOME
99.6/ 100
METRIC RATING
69th/ 347
METRIC RANK

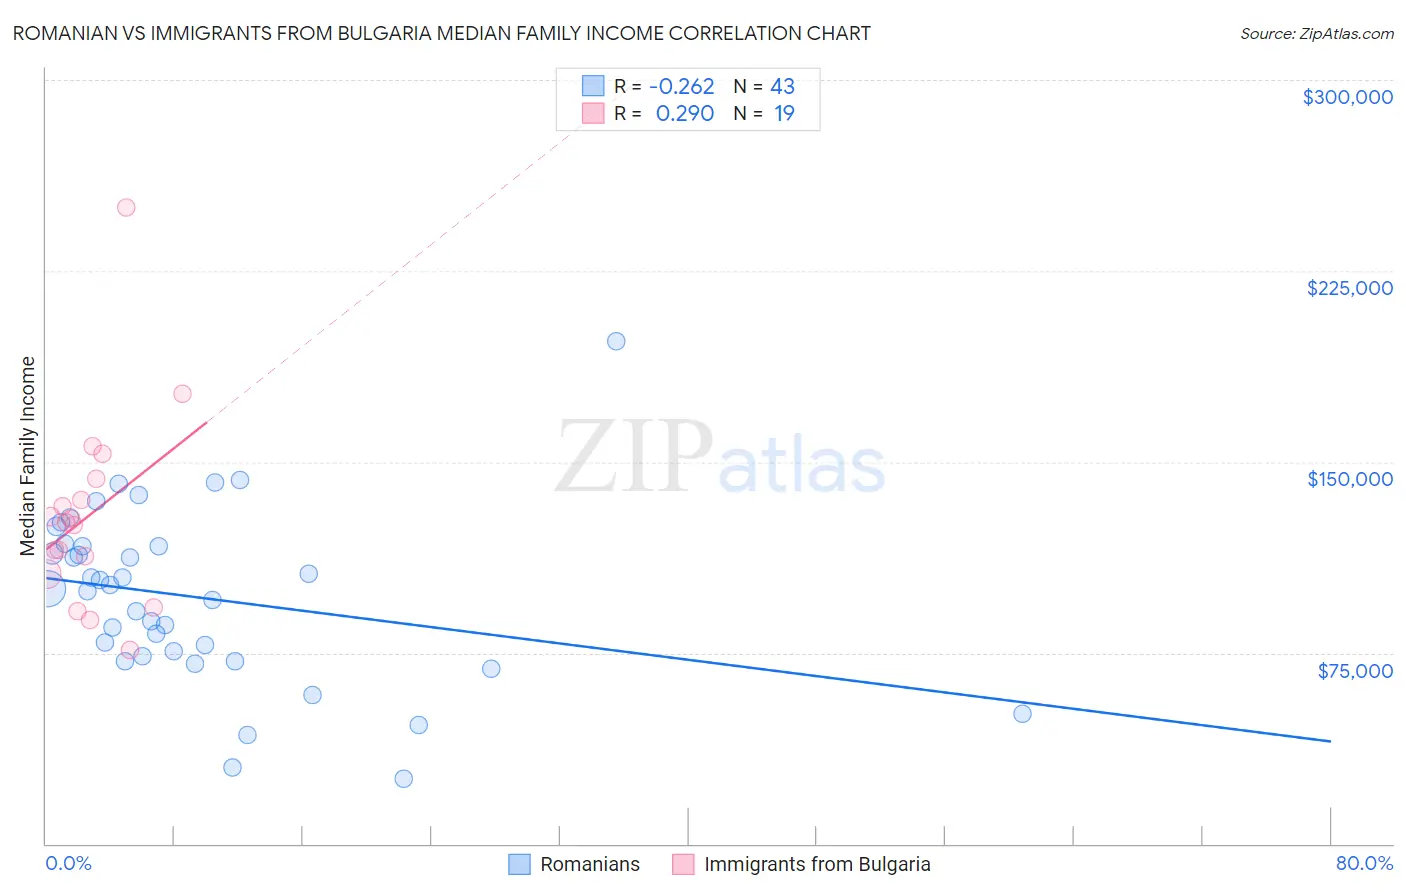
Romanian vs Immigrants from Bulgaria Median Family Income Correlation Chart

The statistical analysis conducted on geographies consisting of 377,611,628 people shows a weak negative correlation between the proportion of Romanians and median family income in the United States with a correlation coefficient (R) of -0.262 and weighted average of $111,243. Similarly, the statistical analysis conducted on geographies consisting of 172,528,300 people shows a weak positive correlation between the proportion of Immigrants from Bulgaria and median family income in the United States with a correlation coefficient (R) of 0.290 and weighted average of $113,461, a difference of 2.0%.
Romanian vs Immigrants from Bulgaria Median Family Income

Median Family Income Correlation Summary

MeasurementRomanianImmigrants from Bulgaria
Minimum$25,417$76,250
Maximum$197,500$250,001
Range$172,083$173,751
Mean$96,934$129,116
Median$100,017$126,024
Interquartile 25% (IQ1)$73,551$106,034
Interquartile 75% (IQ3)$117,024$143,482
Interquartile Range (IQR)$43,473$37,448
Standard Deviation (Sample)$33,876$38,648
Standard Deviation (Population)$33,480$37,618

Demographics Similar to Romanians and Immigrants from Bulgaria by Median Family Income

In terms of median family income, the demographic groups most similar to Romanians are Austrian ($111,306, a difference of 0.060%), Croatian ($111,370, a difference of 0.11%), Ukrainian ($111,368, a difference of 0.11%), Immigrants from Hungary ($111,378, a difference of 0.12%), and Immigrants from Egypt ($111,689, a difference of 0.40%). Similarly, the demographic groups most similar to Immigrants from Bulgaria are Immigrants from Serbia ($113,463, a difference of 0.0%), Immigrants from Romania ($113,434, a difference of 0.020%), South African ($113,229, a difference of 0.20%), Afghan ($112,971, a difference of 0.43%), and Laotian ($112,859, a difference of 0.53%).
DemographicsRating | RankMedian Family Income
Immigrants | Serbia
99.6
/100
|
#68
Exceptional
$113,463
Immigrants | Bulgaria
99.6
/100
|
#69
Exceptional
$113,461
Immigrants | Romania
99.6
/100
|
#70
Exceptional
$113,434
South Africans
99.5
/100
|
#71
Exceptional
$113,229
Afghans
99.5
/100
|
#72
Exceptional
$112,971
Laotians
99.5
/100
|
#73
Exceptional
$112,859
Immigrants | Italy
99.4
/100
|
#74
Exceptional
$112,848
Immigrants | Western Europe
99.4
/100
|
#75
Exceptional
$112,688
Argentineans
99.4
/100
|
#76
Exceptional
$112,665
Immigrants | Eastern Europe
99.4
/100
|
#77
Exceptional
$112,527
Immigrants | Canada
99.3
/100
|
#78
Exceptional
$112,374
Italians
99.3
/100
|
#79
Exceptional
$112,372
Immigrants | Croatia
99.3
/100
|
#80
Exceptional
$112,323
Immigrants | North America
99.2
/100
|
#81
Exceptional
$112,151
Immigrants | England
99.2
/100
|
#82
Exceptional
$112,038
Immigrants | Egypt
99.0
/100
|
#83
Exceptional
$111,689
Immigrants | Hungary
98.8
/100
|
#84
Exceptional
$111,378
Croatians
98.8
/100
|
#85
Exceptional
$111,370
Ukrainians
98.8
/100
|
#86
Exceptional
$111,368
Austrians
98.8
/100
|
#87
Exceptional
$111,306
Romanians
98.8
/100
|
#88
Exceptional
$111,243