Romanian vs Immigrants from Bolivia Median Family Income
COMPARE
Romanian
Immigrants from Bolivia
Median Family Income
Median Family Income Comparison
Romanians
Immigrants from Bolivia
$111,243
MEDIAN FAMILY INCOME
98.8/ 100
METRIC RATING
88th/ 347
METRIC RANK
$117,912
MEDIAN FAMILY INCOME
100.0/ 100
METRIC RATING
42nd/ 347
METRIC RANK
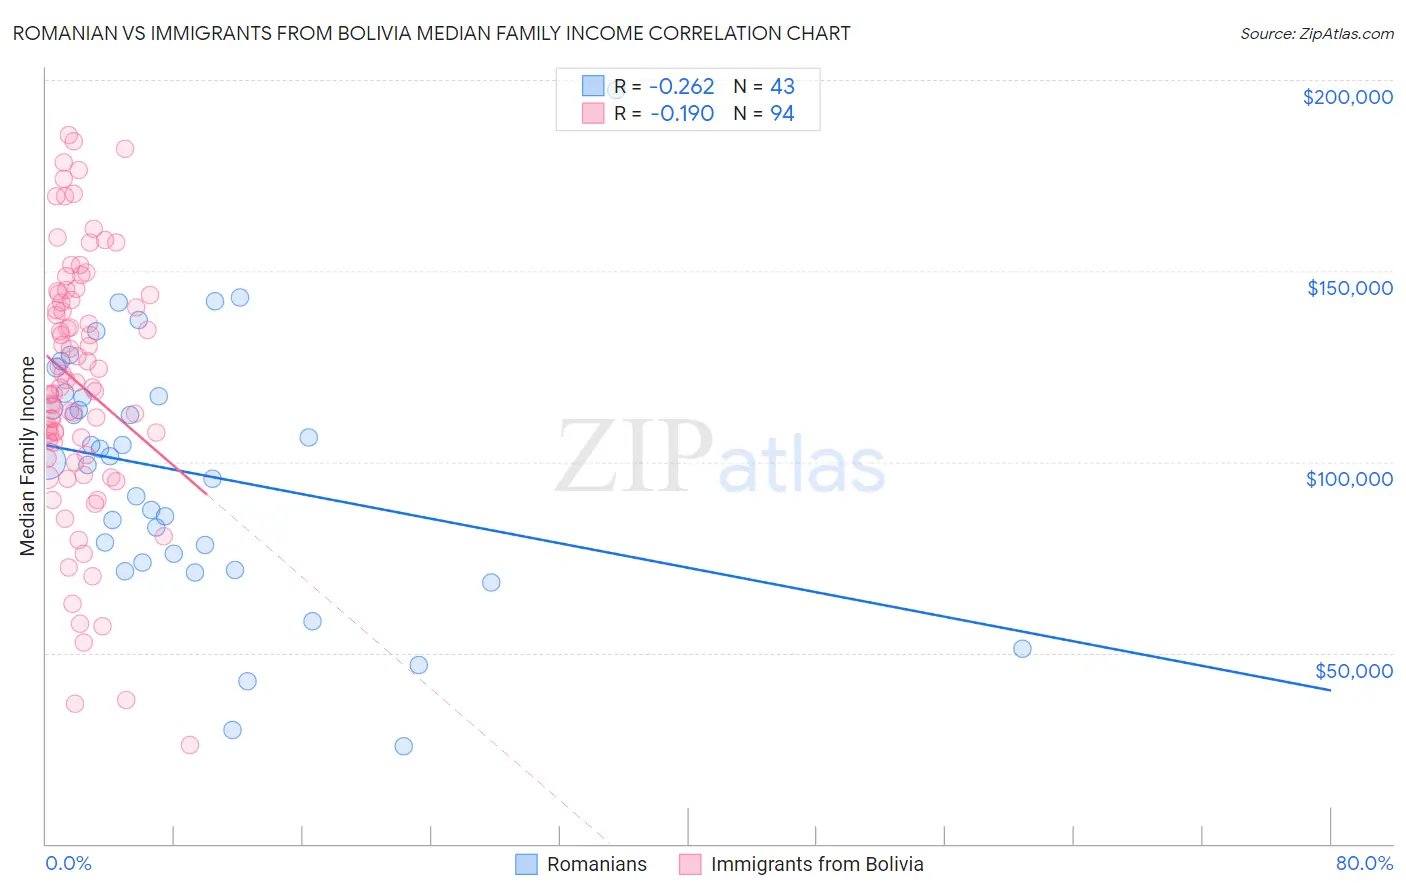
Romanian vs Immigrants from Bolivia Median Family Income Correlation Chart
The statistical analysis conducted on geographies consisting of 377,611,628 people shows a weak negative correlation between the proportion of Romanians and median family income in the United States with a correlation coefficient (R) of -0.262 and weighted average of $111,243. Similarly, the statistical analysis conducted on geographies consisting of 158,713,434 people shows a poor negative correlation between the proportion of Immigrants from Bolivia and median family income in the United States with a correlation coefficient (R) of -0.190 and weighted average of $117,912, a difference of 6.0%.
Median Family Income Correlation Summary
| Measurement | Romanian | Immigrants from Bolivia |
| Minimum | $25,417 | $25,703 |
| Maximum | $197,500 | $185,567 |
| Range | $172,083 | $159,864 |
| Mean | $96,934 | $120,434 |
| Median | $100,017 | $120,122 |
| Interquartile 25% (IQ1) | $73,551 | $101,733 |
| Interquartile 75% (IQ3) | $117,024 | $143,542 |
| Interquartile Range (IQR) | $43,473 | $41,809 |
| Standard Deviation (Sample) | $33,876 | $33,861 |
| Standard Deviation (Population) | $33,480 | $33,681 |
Similar Demographics by Median Family Income
Demographics Similar to Romanians by Median Family Income
In terms of median family income, the demographic groups most similar to Romanians are Austrian ($111,306, a difference of 0.060%), Croatian ($111,370, a difference of 0.11%), Ukrainian ($111,368, a difference of 0.11%), Immigrants from Hungary ($111,378, a difference of 0.12%), and Immigrants from Argentina ($110,873, a difference of 0.33%).
| Demographics | Rating | Rank | Median Family Income |
| Immigrants | North America | 99.2 /100 | #81 | Exceptional $112,151 |
| Immigrants | England | 99.2 /100 | #82 | Exceptional $112,038 |
| Immigrants | Egypt | 99.0 /100 | #83 | Exceptional $111,689 |
| Immigrants | Hungary | 98.8 /100 | #84 | Exceptional $111,378 |
| Croatians | 98.8 /100 | #85 | Exceptional $111,370 |
| Ukrainians | 98.8 /100 | #86 | Exceptional $111,368 |
| Austrians | 98.8 /100 | #87 | Exceptional $111,306 |
| Romanians | 98.8 /100 | #88 | Exceptional $111,243 |
| Immigrants | Argentina | 98.5 /100 | #89 | Exceptional $110,873 |
| Northern Europeans | 98.3 /100 | #90 | Exceptional $110,635 |
| Immigrants | Southern Europe | 98.3 /100 | #91 | Exceptional $110,614 |
| Immigrants | Lebanon | 97.9 /100 | #92 | Exceptional $110,159 |
| Immigrants | Kazakhstan | 97.8 /100 | #93 | Exceptional $110,137 |
| Koreans | 97.8 /100 | #94 | Exceptional $110,103 |
| Zimbabweans | 97.7 /100 | #95 | Exceptional $110,011 |
Demographics Similar to Immigrants from Bolivia by Median Family Income
In terms of median family income, the demographic groups most similar to Immigrants from Bolivia are Bulgarian ($117,818, a difference of 0.080%), Estonian ($118,013, a difference of 0.090%), Cambodian ($117,780, a difference of 0.11%), Immigrants from Lithuania ($118,053, a difference of 0.12%), and Immigrants from Asia ($118,291, a difference of 0.32%).
| Demographics | Rating | Rank | Median Family Income |
| Soviet Union | 100.0 /100 | #35 | Exceptional $119,262 |
| Israelis | 100.0 /100 | #36 | Exceptional $118,577 |
| Australians | 100.0 /100 | #37 | Exceptional $118,440 |
| Immigrants | Turkey | 100.0 /100 | #38 | Exceptional $118,325 |
| Immigrants | Asia | 100.0 /100 | #39 | Exceptional $118,291 |
| Immigrants | Lithuania | 100.0 /100 | #40 | Exceptional $118,053 |
| Estonians | 100.0 /100 | #41 | Exceptional $118,013 |
| Immigrants | Bolivia | 100.0 /100 | #42 | Exceptional $117,912 |
| Bulgarians | 100.0 /100 | #43 | Exceptional $117,818 |
| Cambodians | 100.0 /100 | #44 | Exceptional $117,780 |
| Immigrants | Greece | 99.9 /100 | #45 | Exceptional $117,344 |
| Immigrants | Russia | 99.9 /100 | #46 | Exceptional $116,942 |
| Immigrants | Austria | 99.9 /100 | #47 | Exceptional $116,830 |
| Immigrants | South Africa | 99.9 /100 | #48 | Exceptional $116,286 |
| Chinese | 99.9 /100 | #49 | Exceptional $116,188 |