Romanian vs Lithuanian Single Mother Poverty
COMPARE
Romanian
Lithuanian
Single Mother Poverty
Single Mother Poverty Comparison
Romanians
Lithuanians
27.8%
SINGLE MOTHER POVERTY
97.8/ 100
METRIC RATING
93rd/ 347
METRIC RANK
27.4%
SINGLE MOTHER POVERTY
99.4/ 100
METRIC RATING
69th/ 347
METRIC RANK
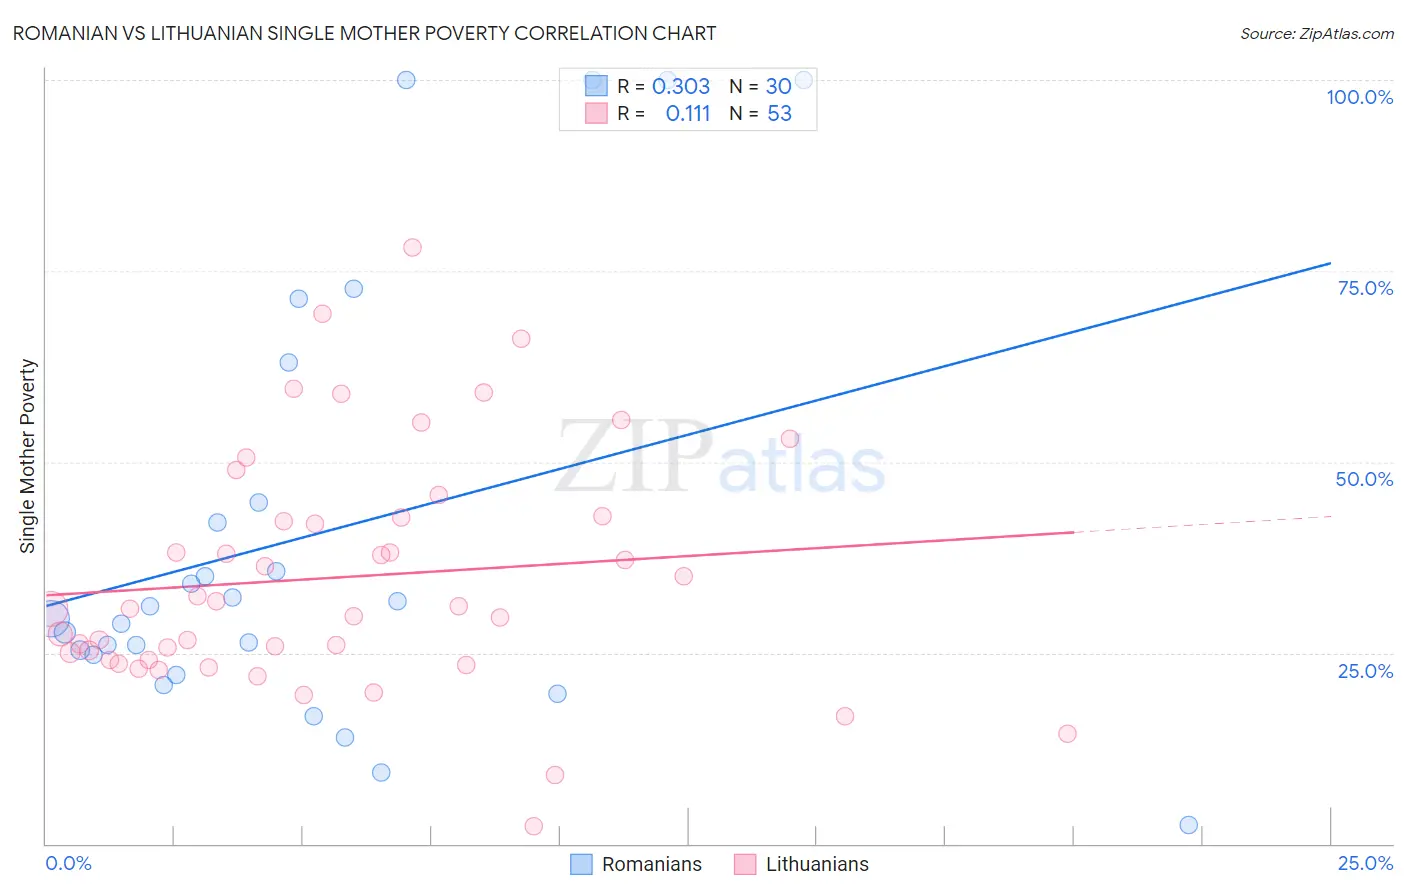
Romanian vs Lithuanian Single Mother Poverty Correlation Chart
The statistical analysis conducted on geographies consisting of 367,510,657 people shows a mild positive correlation between the proportion of Romanians and poverty level among single mothers in the United States with a correlation coefficient (R) of 0.303 and weighted average of 27.8%. Similarly, the statistical analysis conducted on geographies consisting of 407,174,767 people shows a poor positive correlation between the proportion of Lithuanians and poverty level among single mothers in the United States with a correlation coefficient (R) of 0.111 and weighted average of 27.4%, a difference of 1.7%.
Single Mother Poverty Correlation Summary
| Measurement | Romanian | Lithuanian |
| Minimum | 2.5% | 2.2% |
| Maximum | 100.0% | 78.1% |
| Range | 97.5% | 75.9% |
| Mean | 40.4% | 34.9% |
| Median | 30.2% | 30.8% |
| Interquartile 25% (IQ1) | 24.8% | 24.1% |
| Interquartile 75% (IQ3) | 44.7% | 42.8% |
| Interquartile Range (IQR) | 19.9% | 18.7% |
| Standard Deviation (Sample) | 28.4% | 15.6% |
| Standard Deviation (Population) | 27.9% | 15.5% |
Similar Demographics by Single Mother Poverty
Demographics Similar to Romanians by Single Mother Poverty
In terms of single mother poverty, the demographic groups most similar to Romanians are Estonian (27.8%, a difference of 0.10%), Albanian (27.9%, a difference of 0.10%), Immigrants from Albania (27.8%, a difference of 0.12%), Chilean (27.9%, a difference of 0.13%), and Immigrants from Iraq (27.9%, a difference of 0.23%).
| Demographics | Rating | Rank | Single Mother Poverty |
| Immigrants | Ukraine | 98.6 /100 | #86 | Exceptional 27.7% |
| Afghans | 98.5 /100 | #87 | Exceptional 27.7% |
| Ethiopians | 98.4 /100 | #88 | Exceptional 27.7% |
| Immigrants | Ethiopia | 98.4 /100 | #89 | Exceptional 27.7% |
| Immigrants | France | 98.2 /100 | #90 | Exceptional 27.8% |
| Immigrants | Albania | 98.0 /100 | #91 | Exceptional 27.8% |
| Estonians | 97.9 /100 | #92 | Exceptional 27.8% |
| Romanians | 97.8 /100 | #93 | Exceptional 27.8% |
| Albanians | 97.6 /100 | #94 | Exceptional 27.9% |
| Chileans | 97.5 /100 | #95 | Exceptional 27.9% |
| Immigrants | Iraq | 97.3 /100 | #96 | Exceptional 27.9% |
| Immigrants | Brazil | 97.2 /100 | #97 | Exceptional 27.9% |
| Immigrants | Nepal | 97.2 /100 | #98 | Exceptional 27.9% |
| Immigrants | Netherlands | 97.2 /100 | #99 | Exceptional 27.9% |
| Zimbabweans | 97.1 /100 | #100 | Exceptional 27.9% |
Demographics Similar to Lithuanians by Single Mother Poverty
In terms of single mother poverty, the demographic groups most similar to Lithuanians are Immigrants from Belarus (27.4%, a difference of 0.010%), Macedonian (27.4%, a difference of 0.030%), Immigrants from Russia (27.4%, a difference of 0.060%), Sierra Leonean (27.4%, a difference of 0.12%), and Immigrants from Czechoslovakia (27.4%, a difference of 0.16%).
| Demographics | Rating | Rank | Single Mother Poverty |
| Immigrants | Malaysia | 99.5 /100 | #62 | Exceptional 27.3% |
| Immigrants | Northern Europe | 99.5 /100 | #63 | Exceptional 27.3% |
| Russians | 99.5 /100 | #64 | Exceptional 27.3% |
| Immigrants | Turkey | 99.5 /100 | #65 | Exceptional 27.3% |
| Soviet Union | 99.5 /100 | #66 | Exceptional 27.3% |
| Immigrants | Australia | 99.5 /100 | #67 | Exceptional 27.3% |
| Immigrants | Czechoslovakia | 99.5 /100 | #68 | Exceptional 27.4% |
| Lithuanians | 99.4 /100 | #69 | Exceptional 27.4% |
| Immigrants | Belarus | 99.4 /100 | #70 | Exceptional 27.4% |
| Macedonians | 99.4 /100 | #71 | Exceptional 27.4% |
| Immigrants | Russia | 99.4 /100 | #72 | Exceptional 27.4% |
| Sierra Leoneans | 99.3 /100 | #73 | Exceptional 27.4% |
| Immigrants | Europe | 99.3 /100 | #74 | Exceptional 27.4% |
| Immigrants | Sweden | 99.2 /100 | #75 | Exceptional 27.5% |
| Peruvians | 99.2 /100 | #76 | Exceptional 27.5% |