Romanian vs Immigrants from Northern Europe Median Family Income
COMPARE
Romanian
Immigrants from Northern Europe
Median Family Income
Median Family Income Comparison
Romanians
Immigrants from Northern Europe
$111,243
MEDIAN FAMILY INCOME
98.8/ 100
METRIC RATING
88th/ 347
METRIC RANK
$121,840
MEDIAN FAMILY INCOME
100.0/ 100
METRIC RATING
24th/ 347
METRIC RANK
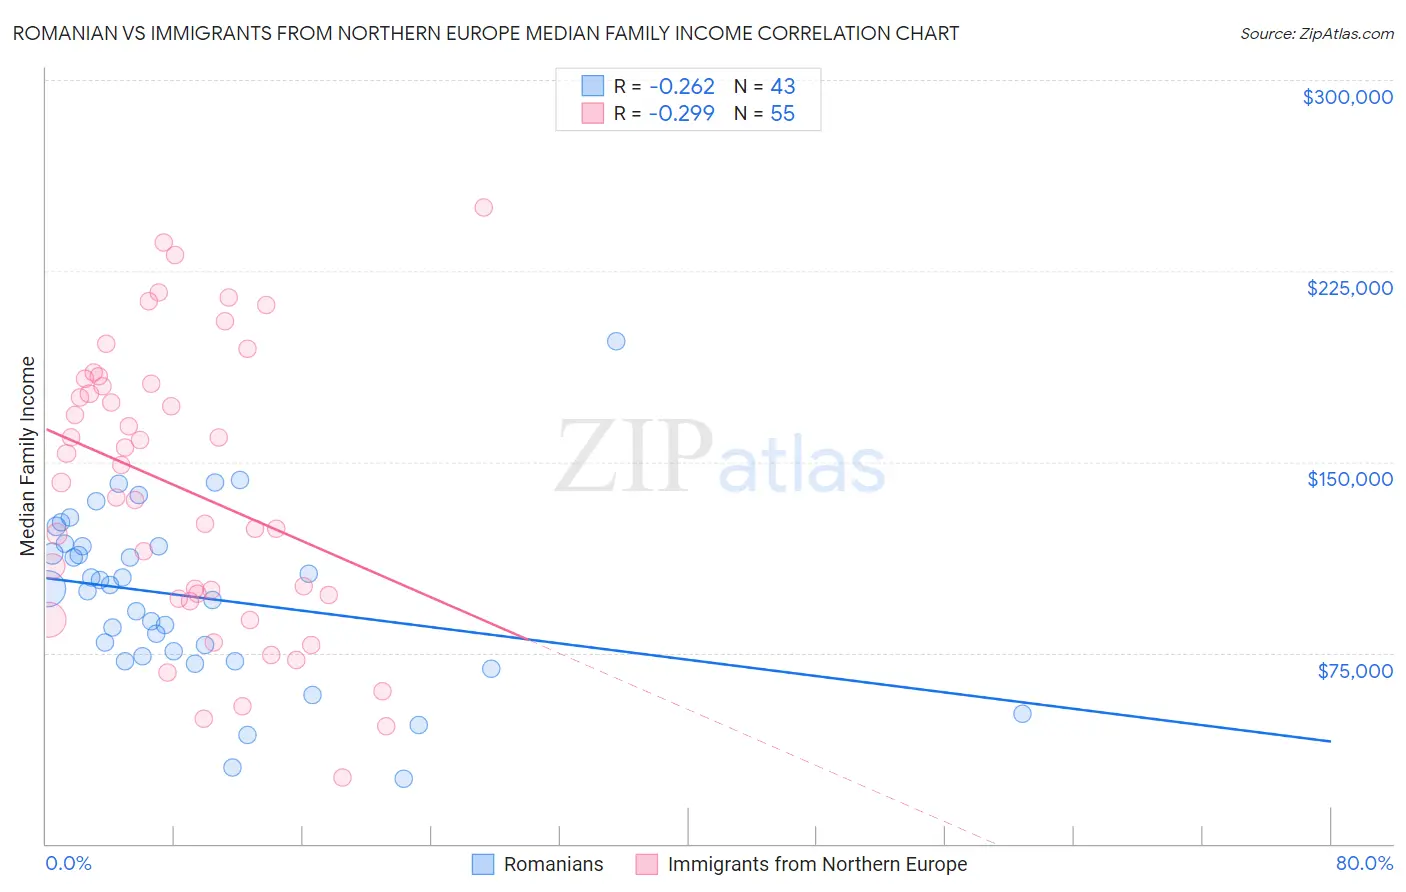
Romanian vs Immigrants from Northern Europe Median Family Income Correlation Chart
The statistical analysis conducted on geographies consisting of 377,611,628 people shows a weak negative correlation between the proportion of Romanians and median family income in the United States with a correlation coefficient (R) of -0.262 and weighted average of $111,243. Similarly, the statistical analysis conducted on geographies consisting of 476,742,479 people shows a weak negative correlation between the proportion of Immigrants from Northern Europe and median family income in the United States with a correlation coefficient (R) of -0.299 and weighted average of $121,840, a difference of 9.5%.
Median Family Income Correlation Summary
| Measurement | Romanian | Immigrants from Northern Europe |
| Minimum | $25,417 | $26,250 |
| Maximum | $197,500 | $250,001 |
| Range | $172,083 | $223,751 |
| Mean | $96,934 | $139,082 |
| Median | $100,017 | $142,088 |
| Interquartile 25% (IQ1) | $73,551 | $96,250 |
| Interquartile 75% (IQ3) | $117,024 | $180,658 |
| Interquartile Range (IQR) | $43,473 | $84,408 |
| Standard Deviation (Sample) | $33,876 | $55,193 |
| Standard Deviation (Population) | $33,480 | $54,689 |
Similar Demographics by Median Family Income
Demographics Similar to Romanians by Median Family Income
In terms of median family income, the demographic groups most similar to Romanians are Austrian ($111,306, a difference of 0.060%), Croatian ($111,370, a difference of 0.11%), Ukrainian ($111,368, a difference of 0.11%), Immigrants from Hungary ($111,378, a difference of 0.12%), and Immigrants from Argentina ($110,873, a difference of 0.33%).
| Demographics | Rating | Rank | Median Family Income |
| Immigrants | North America | 99.2 /100 | #81 | Exceptional $112,151 |
| Immigrants | England | 99.2 /100 | #82 | Exceptional $112,038 |
| Immigrants | Egypt | 99.0 /100 | #83 | Exceptional $111,689 |
| Immigrants | Hungary | 98.8 /100 | #84 | Exceptional $111,378 |
| Croatians | 98.8 /100 | #85 | Exceptional $111,370 |
| Ukrainians | 98.8 /100 | #86 | Exceptional $111,368 |
| Austrians | 98.8 /100 | #87 | Exceptional $111,306 |
| Romanians | 98.8 /100 | #88 | Exceptional $111,243 |
| Immigrants | Argentina | 98.5 /100 | #89 | Exceptional $110,873 |
| Northern Europeans | 98.3 /100 | #90 | Exceptional $110,635 |
| Immigrants | Southern Europe | 98.3 /100 | #91 | Exceptional $110,614 |
| Immigrants | Lebanon | 97.9 /100 | #92 | Exceptional $110,159 |
| Immigrants | Kazakhstan | 97.8 /100 | #93 | Exceptional $110,137 |
| Koreans | 97.8 /100 | #94 | Exceptional $110,103 |
| Zimbabweans | 97.7 /100 | #95 | Exceptional $110,011 |
Demographics Similar to Immigrants from Northern Europe by Median Family Income
In terms of median family income, the demographic groups most similar to Immigrants from Northern Europe are Turkish ($121,202, a difference of 0.53%), Immigrants from Sweden ($122,765, a difference of 0.76%), Immigrants from Japan ($122,764, a difference of 0.76%), Immigrants from Korea ($122,800, a difference of 0.79%), and Immigrants from Switzerland ($120,726, a difference of 0.92%).
| Demographics | Rating | Rank | Median Family Income |
| Indians (Asian) | 100.0 /100 | #17 | Exceptional $125,312 |
| Immigrants | Eastern Asia | 100.0 /100 | #18 | Exceptional $125,150 |
| Immigrants | Belgium | 100.0 /100 | #19 | Exceptional $123,831 |
| Burmese | 100.0 /100 | #20 | Exceptional $123,369 |
| Immigrants | Korea | 100.0 /100 | #21 | Exceptional $122,800 |
| Immigrants | Sweden | 100.0 /100 | #22 | Exceptional $122,765 |
| Immigrants | Japan | 100.0 /100 | #23 | Exceptional $122,764 |
| Immigrants | Northern Europe | 100.0 /100 | #24 | Exceptional $121,840 |
| Turks | 100.0 /100 | #25 | Exceptional $121,202 |
| Immigrants | Switzerland | 100.0 /100 | #26 | Exceptional $120,726 |
| Russians | 100.0 /100 | #27 | Exceptional $120,487 |
| Immigrants | Denmark | 100.0 /100 | #28 | Exceptional $120,445 |
| Latvians | 100.0 /100 | #29 | Exceptional $120,301 |
| Immigrants | Sri Lanka | 100.0 /100 | #30 | Exceptional $120,263 |
| Immigrants | France | 100.0 /100 | #31 | Exceptional $120,076 |