Sudanese vs Lithuanian Median Family Income
COMPARE
Sudanese
Lithuanian
Median Family Income
Median Family Income Comparison
Sudanese
Lithuanians
$96,783
MEDIAN FAMILY INCOME
4.7/ 100
METRIC RATING
220th/ 347
METRIC RANK
$115,395
MEDIAN FAMILY INCOME
99.8/ 100
METRIC RATING
55th/ 347
METRIC RANK
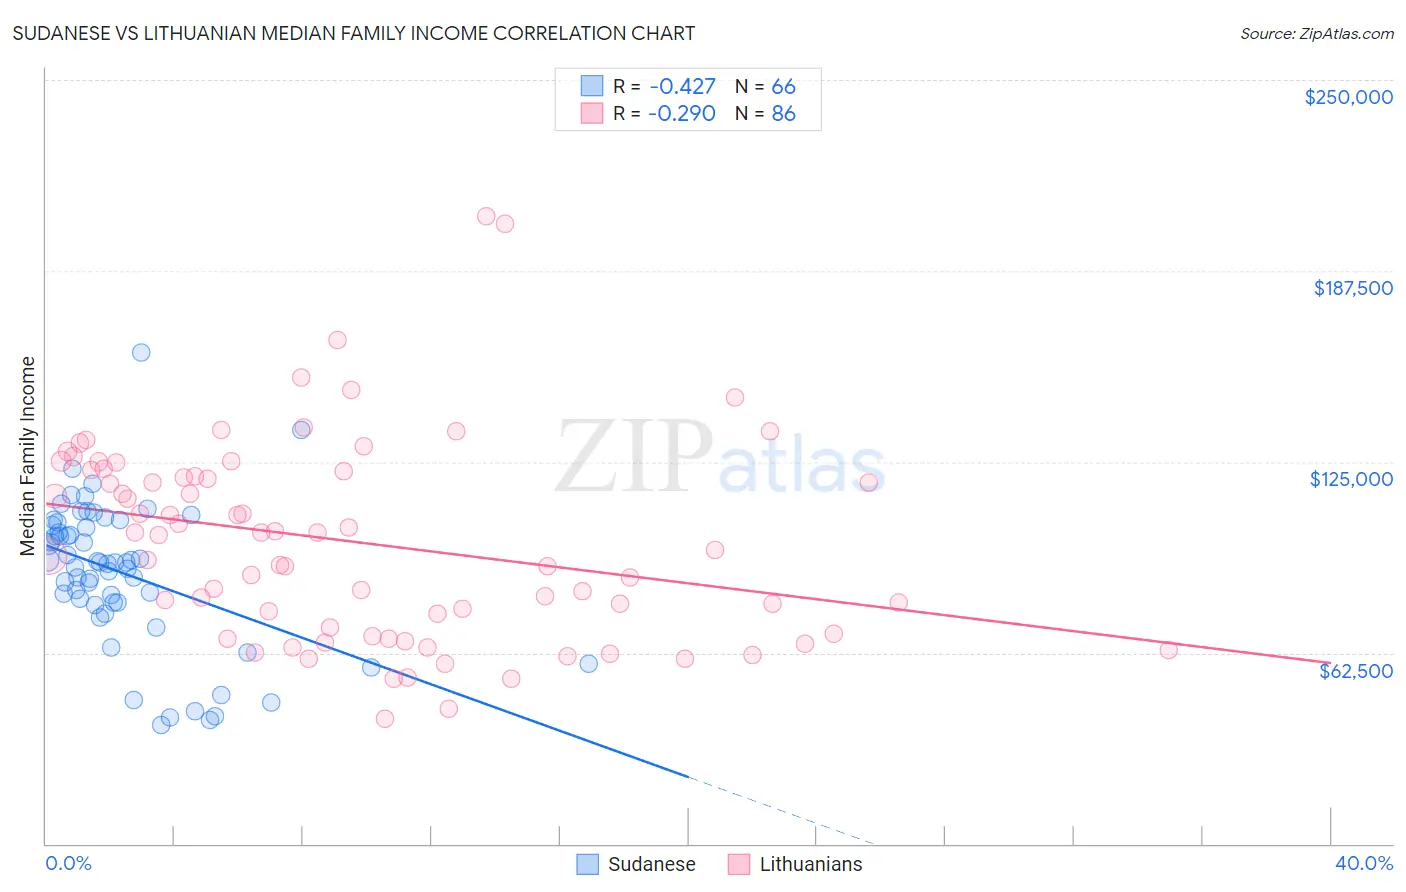
Sudanese vs Lithuanian Median Family Income Correlation Chart
The statistical analysis conducted on geographies consisting of 110,081,716 people shows a moderate negative correlation between the proportion of Sudanese and median family income in the United States with a correlation coefficient (R) of -0.427 and weighted average of $96,783. Similarly, the statistical analysis conducted on geographies consisting of 421,580,466 people shows a weak negative correlation between the proportion of Lithuanians and median family income in the United States with a correlation coefficient (R) of -0.290 and weighted average of $115,395, a difference of 19.2%.
Median Family Income Correlation Summary
| Measurement | Sudanese | Lithuanian |
| Minimum | $38,840 | $40,809 |
| Maximum | $160,922 | $205,368 |
| Range | $122,082 | $164,559 |
| Mean | $88,541 | $98,726 |
| Median | $92,056 | $98,683 |
| Interquartile 25% (IQ1) | $78,776 | $68,538 |
| Interquartile 75% (IQ3) | $104,200 | $122,072 |
| Interquartile Range (IQR) | $25,424 | $53,534 |
| Standard Deviation (Sample) | $23,841 | $32,784 |
| Standard Deviation (Population) | $23,660 | $32,593 |
Similar Demographics by Median Family Income
Demographics Similar to Sudanese by Median Family Income
In terms of median family income, the demographic groups most similar to Sudanese are Delaware ($96,958, a difference of 0.18%), Immigrants from Ghana ($96,544, a difference of 0.25%), Immigrants from Nigeria ($96,439, a difference of 0.36%), Immigrants from Cambodia ($97,222, a difference of 0.45%), and Japanese ($97,288, a difference of 0.52%).
| Demographics | Rating | Rank | Median Family Income |
| Immigrants | Armenia | 7.0 /100 | #213 | Tragic $97,605 |
| Bermudans | 6.9 /100 | #214 | Tragic $97,577 |
| Nigerians | 6.7 /100 | #215 | Tragic $97,522 |
| Immigrants | Bosnia and Herzegovina | 6.4 /100 | #216 | Tragic $97,432 |
| Japanese | 6.0 /100 | #217 | Tragic $97,288 |
| Immigrants | Cambodia | 5.8 /100 | #218 | Tragic $97,222 |
| Delaware | 5.1 /100 | #219 | Tragic $96,958 |
| Sudanese | 4.7 /100 | #220 | Tragic $96,783 |
| Immigrants | Ghana | 4.2 /100 | #221 | Tragic $96,544 |
| Immigrants | Nigeria | 4.0 /100 | #222 | Tragic $96,439 |
| Venezuelans | 3.7 /100 | #223 | Tragic $96,281 |
| Immigrants | Nonimmigrants | 3.6 /100 | #224 | Tragic $96,231 |
| Vietnamese | 3.4 /100 | #225 | Tragic $96,123 |
| Immigrants | Panama | 2.7 /100 | #226 | Tragic $95,647 |
| Alaska Natives | 2.6 /100 | #227 | Tragic $95,573 |
Demographics Similar to Lithuanians by Median Family Income
In terms of median family income, the demographic groups most similar to Lithuanians are Immigrants from Europe ($115,523, a difference of 0.11%), New Zealander ($115,230, a difference of 0.14%), Greek ($115,192, a difference of 0.18%), Immigrants from Indonesia ($115,162, a difference of 0.20%), and Immigrants from Netherlands ($114,987, a difference of 0.35%).
| Demographics | Rating | Rank | Median Family Income |
| Immigrants | South Africa | 99.9 /100 | #48 | Exceptional $116,286 |
| Chinese | 99.9 /100 | #49 | Exceptional $116,188 |
| Immigrants | Czechoslovakia | 99.9 /100 | #50 | Exceptional $116,165 |
| Immigrants | Malaysia | 99.9 /100 | #51 | Exceptional $115,880 |
| Maltese | 99.9 /100 | #52 | Exceptional $115,862 |
| Immigrants | Norway | 99.9 /100 | #53 | Exceptional $115,847 |
| Immigrants | Europe | 99.9 /100 | #54 | Exceptional $115,523 |
| Lithuanians | 99.8 /100 | #55 | Exceptional $115,395 |
| New Zealanders | 99.8 /100 | #56 | Exceptional $115,230 |
| Greeks | 99.8 /100 | #57 | Exceptional $115,192 |
| Immigrants | Indonesia | 99.8 /100 | #58 | Exceptional $115,162 |
| Immigrants | Netherlands | 99.8 /100 | #59 | Exceptional $114,987 |
| Immigrants | Latvia | 99.8 /100 | #60 | Exceptional $114,826 |
| Immigrants | Belarus | 99.8 /100 | #61 | Exceptional $114,586 |
| Mongolians | 99.8 /100 | #62 | Exceptional $114,553 |