Romanian vs Iranian Median Family Income
COMPARE
Romanian
Iranian
Median Family Income
Median Family Income Comparison
Romanians
Iranians
$111,243
MEDIAN FAMILY INCOME
98.8/ 100
METRIC RATING
88th/ 347
METRIC RANK
$133,839
MEDIAN FAMILY INCOME
100.0/ 100
METRIC RATING
5th/ 347
METRIC RANK
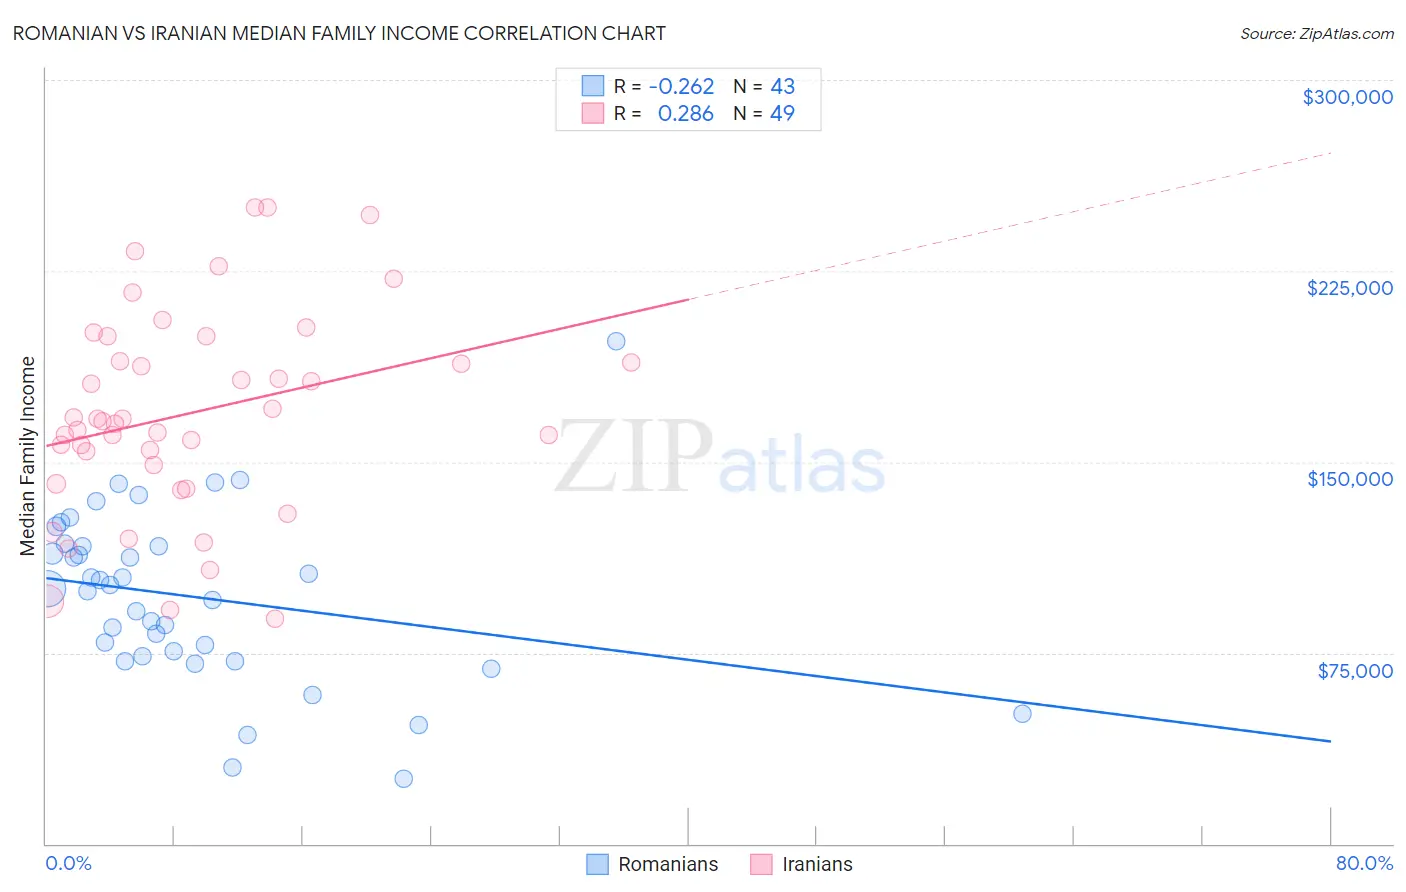
Romanian vs Iranian Median Family Income Correlation Chart
The statistical analysis conducted on geographies consisting of 377,611,628 people shows a weak negative correlation between the proportion of Romanians and median family income in the United States with a correlation coefficient (R) of -0.262 and weighted average of $111,243. Similarly, the statistical analysis conducted on geographies consisting of 316,569,365 people shows a weak positive correlation between the proportion of Iranians and median family income in the United States with a correlation coefficient (R) of 0.286 and weighted average of $133,839, a difference of 20.3%.
Median Family Income Correlation Summary
| Measurement | Romanian | Iranian |
| Minimum | $25,417 | $88,250 |
| Maximum | $197,500 | $250,001 |
| Range | $172,083 | $161,751 |
| Mean | $96,934 | $169,044 |
| Median | $100,017 | $166,027 |
| Interquartile 25% (IQ1) | $73,551 | $144,981 |
| Interquartile 75% (IQ3) | $117,024 | $194,217 |
| Interquartile Range (IQR) | $43,473 | $49,236 |
| Standard Deviation (Sample) | $33,876 | $39,948 |
| Standard Deviation (Population) | $33,480 | $39,538 |
Similar Demographics by Median Family Income
Demographics Similar to Romanians by Median Family Income
In terms of median family income, the demographic groups most similar to Romanians are Austrian ($111,306, a difference of 0.060%), Croatian ($111,370, a difference of 0.11%), Ukrainian ($111,368, a difference of 0.11%), Immigrants from Hungary ($111,378, a difference of 0.12%), and Immigrants from Argentina ($110,873, a difference of 0.33%).
| Demographics | Rating | Rank | Median Family Income |
| Immigrants | North America | 99.2 /100 | #81 | Exceptional $112,151 |
| Immigrants | England | 99.2 /100 | #82 | Exceptional $112,038 |
| Immigrants | Egypt | 99.0 /100 | #83 | Exceptional $111,689 |
| Immigrants | Hungary | 98.8 /100 | #84 | Exceptional $111,378 |
| Croatians | 98.8 /100 | #85 | Exceptional $111,370 |
| Ukrainians | 98.8 /100 | #86 | Exceptional $111,368 |
| Austrians | 98.8 /100 | #87 | Exceptional $111,306 |
| Romanians | 98.8 /100 | #88 | Exceptional $111,243 |
| Immigrants | Argentina | 98.5 /100 | #89 | Exceptional $110,873 |
| Northern Europeans | 98.3 /100 | #90 | Exceptional $110,635 |
| Immigrants | Southern Europe | 98.3 /100 | #91 | Exceptional $110,614 |
| Immigrants | Lebanon | 97.9 /100 | #92 | Exceptional $110,159 |
| Immigrants | Kazakhstan | 97.8 /100 | #93 | Exceptional $110,137 |
| Koreans | 97.8 /100 | #94 | Exceptional $110,103 |
| Zimbabweans | 97.7 /100 | #95 | Exceptional $110,011 |
Demographics Similar to Iranians by Median Family Income
In terms of median family income, the demographic groups most similar to Iranians are Immigrants from India ($134,028, a difference of 0.14%), Immigrants from Singapore ($134,818, a difference of 0.73%), Thai ($131,281, a difference of 1.9%), Immigrants from Hong Kong ($131,067, a difference of 2.1%), and Immigrants from Iran ($130,894, a difference of 2.2%).
| Demographics | Rating | Rank | Median Family Income |
| Filipinos | 100.0 /100 | #1 | Exceptional $138,397 |
| Immigrants | Taiwan | 100.0 /100 | #2 | Exceptional $136,949 |
| Immigrants | Singapore | 100.0 /100 | #3 | Exceptional $134,818 |
| Immigrants | India | 100.0 /100 | #4 | Exceptional $134,028 |
| Iranians | 100.0 /100 | #5 | Exceptional $133,839 |
| Thais | 100.0 /100 | #6 | Exceptional $131,281 |
| Immigrants | Hong Kong | 100.0 /100 | #7 | Exceptional $131,067 |
| Immigrants | Iran | 100.0 /100 | #8 | Exceptional $130,894 |
| Okinawans | 100.0 /100 | #9 | Exceptional $129,979 |
| Immigrants | Ireland | 100.0 /100 | #10 | Exceptional $127,584 |
| Immigrants | Israel | 100.0 /100 | #11 | Exceptional $127,430 |
| Cypriots | 100.0 /100 | #12 | Exceptional $127,064 |
| Immigrants | Australia | 100.0 /100 | #13 | Exceptional $126,620 |
| Immigrants | South Central Asia | 100.0 /100 | #14 | Exceptional $125,956 |
| Eastern Europeans | 100.0 /100 | #15 | Exceptional $125,546 |