Romanian vs Mexican Median Family Income
COMPARE
Romanian
Mexican
Median Family Income
Median Family Income Comparison
Romanians
Mexicans
$111,243
MEDIAN FAMILY INCOME
98.8/ 100
METRIC RATING
88th/ 347
METRIC RANK
$85,618
MEDIAN FAMILY INCOME
0.0/ 100
METRIC RATING
304th/ 347
METRIC RANK
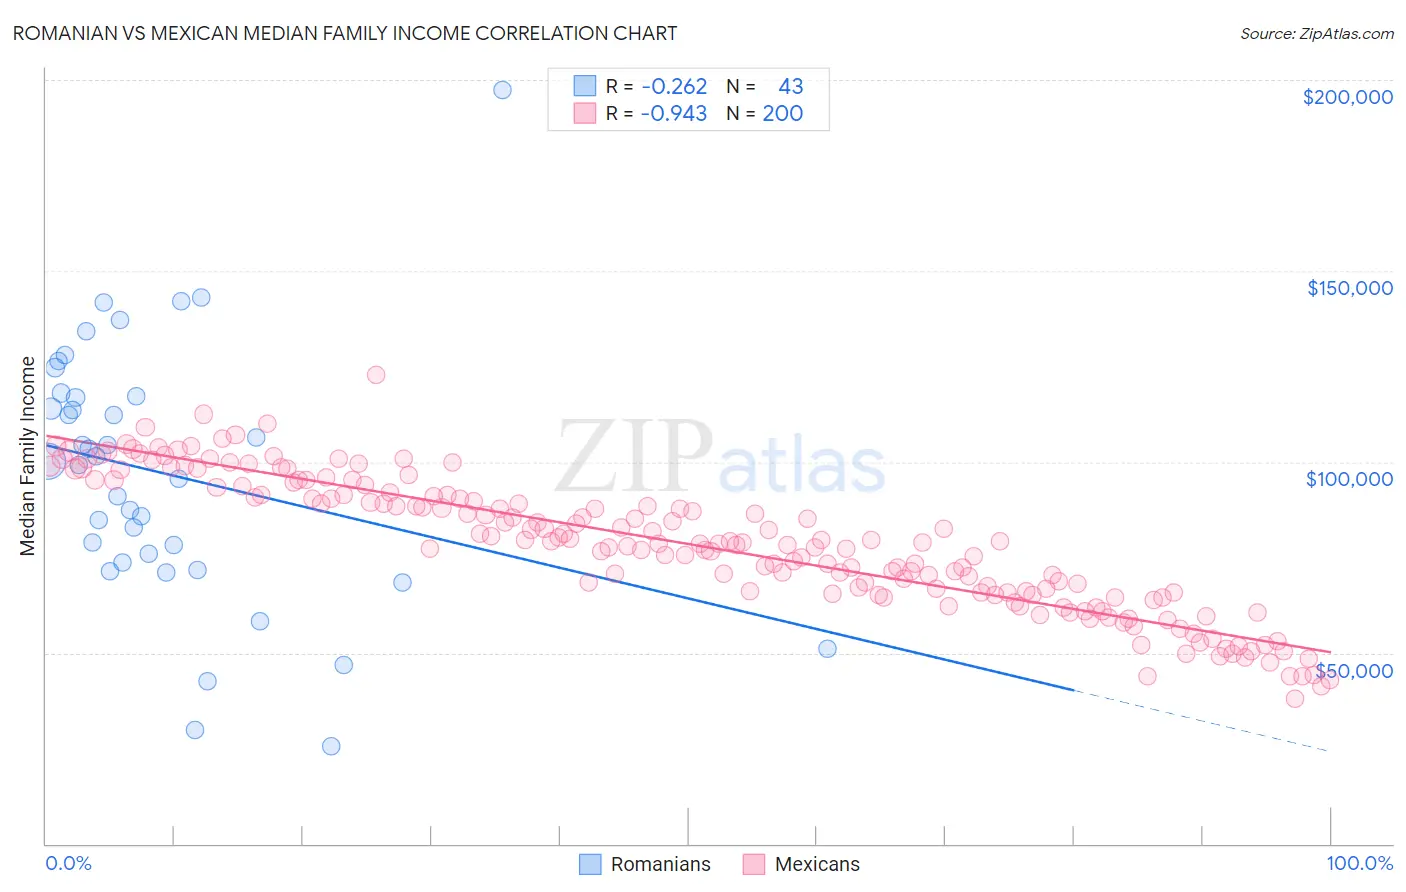
Romanian vs Mexican Median Family Income Correlation Chart
The statistical analysis conducted on geographies consisting of 377,611,628 people shows a weak negative correlation between the proportion of Romanians and median family income in the United States with a correlation coefficient (R) of -0.262 and weighted average of $111,243. Similarly, the statistical analysis conducted on geographies consisting of 563,853,219 people shows a near-perfect negative correlation between the proportion of Mexicans and median family income in the United States with a correlation coefficient (R) of -0.943 and weighted average of $85,618, a difference of 29.9%.
Median Family Income Correlation Summary
| Measurement | Romanian | Mexican |
| Minimum | $25,417 | $37,850 |
| Maximum | $197,500 | $122,714 |
| Range | $172,083 | $84,864 |
| Mean | $96,934 | $78,476 |
| Median | $100,017 | $78,807 |
| Interquartile 25% (IQ1) | $73,551 | $65,810 |
| Interquartile 75% (IQ3) | $117,024 | $91,475 |
| Interquartile Range (IQR) | $43,473 | $25,665 |
| Standard Deviation (Sample) | $33,876 | $17,414 |
| Standard Deviation (Population) | $33,480 | $17,371 |
Similar Demographics by Median Family Income
Demographics Similar to Romanians by Median Family Income
In terms of median family income, the demographic groups most similar to Romanians are Austrian ($111,306, a difference of 0.060%), Croatian ($111,370, a difference of 0.11%), Ukrainian ($111,368, a difference of 0.11%), Immigrants from Hungary ($111,378, a difference of 0.12%), and Immigrants from Argentina ($110,873, a difference of 0.33%).
| Demographics | Rating | Rank | Median Family Income |
| Immigrants | North America | 99.2 /100 | #81 | Exceptional $112,151 |
| Immigrants | England | 99.2 /100 | #82 | Exceptional $112,038 |
| Immigrants | Egypt | 99.0 /100 | #83 | Exceptional $111,689 |
| Immigrants | Hungary | 98.8 /100 | #84 | Exceptional $111,378 |
| Croatians | 98.8 /100 | #85 | Exceptional $111,370 |
| Ukrainians | 98.8 /100 | #86 | Exceptional $111,368 |
| Austrians | 98.8 /100 | #87 | Exceptional $111,306 |
| Romanians | 98.8 /100 | #88 | Exceptional $111,243 |
| Immigrants | Argentina | 98.5 /100 | #89 | Exceptional $110,873 |
| Northern Europeans | 98.3 /100 | #90 | Exceptional $110,635 |
| Immigrants | Southern Europe | 98.3 /100 | #91 | Exceptional $110,614 |
| Immigrants | Lebanon | 97.9 /100 | #92 | Exceptional $110,159 |
| Immigrants | Kazakhstan | 97.8 /100 | #93 | Exceptional $110,137 |
| Koreans | 97.8 /100 | #94 | Exceptional $110,103 |
| Zimbabweans | 97.7 /100 | #95 | Exceptional $110,011 |
Demographics Similar to Mexicans by Median Family Income
In terms of median family income, the demographic groups most similar to Mexicans are Hispanic or Latino ($85,647, a difference of 0.030%), Spanish American Indian ($85,728, a difference of 0.13%), Colville ($85,792, a difference of 0.20%), Paiute ($85,414, a difference of 0.24%), and Immigrants from Dominica ($85,411, a difference of 0.24%).
| Demographics | Rating | Rank | Median Family Income |
| Cajuns | 0.0 /100 | #297 | Tragic $87,157 |
| Immigrants | Latin America | 0.0 /100 | #298 | Tragic $86,989 |
| Chippewa | 0.0 /100 | #299 | Tragic $86,852 |
| Ottawa | 0.0 /100 | #300 | Tragic $86,380 |
| Colville | 0.0 /100 | #301 | Tragic $85,792 |
| Spanish American Indians | 0.0 /100 | #302 | Tragic $85,728 |
| Hispanics or Latinos | 0.0 /100 | #303 | Tragic $85,647 |
| Mexicans | 0.0 /100 | #304 | Tragic $85,618 |
| Paiute | 0.0 /100 | #305 | Tragic $85,414 |
| Immigrants | Dominica | 0.0 /100 | #306 | Tragic $85,411 |
| Chickasaw | 0.0 /100 | #307 | Tragic $85,356 |
| U.S. Virgin Islanders | 0.0 /100 | #308 | Tragic $85,294 |
| Haitians | 0.0 /100 | #309 | Tragic $85,218 |
| Immigrants | Central America | 0.0 /100 | #310 | Tragic $85,050 |
| Hondurans | 0.0 /100 | #311 | Tragic $85,004 |