Potawatomi vs Immigrants from Pakistan Median Male Earnings
COMPARE
Potawatomi
Immigrants from Pakistan
Median Male Earnings
Median Male Earnings Comparison
Potawatomi
Immigrants from Pakistan
$48,768
MEDIAN MALE EARNINGS
0.4/ 100
METRIC RATING
270th/ 347
METRIC RANK
$60,987
MEDIAN MALE EARNINGS
99.8/ 100
METRIC RATING
63rd/ 347
METRIC RANK
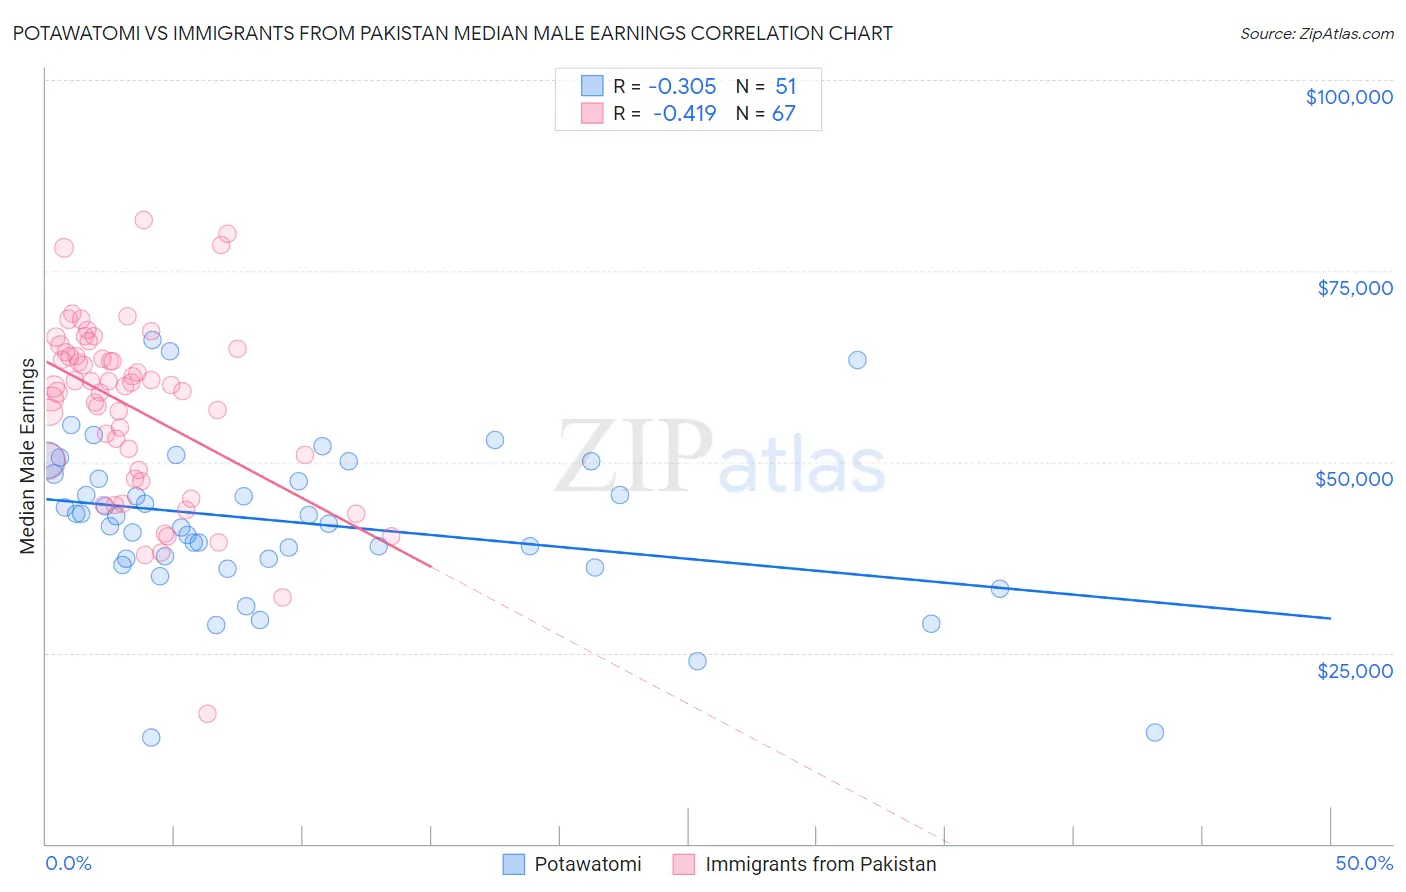
Potawatomi vs Immigrants from Pakistan Median Male Earnings Correlation Chart
The statistical analysis conducted on geographies consisting of 117,758,062 people shows a mild negative correlation between the proportion of Potawatomi and median male earnings in the United States with a correlation coefficient (R) of -0.305 and weighted average of $48,768. Similarly, the statistical analysis conducted on geographies consisting of 283,803,511 people shows a moderate negative correlation between the proportion of Immigrants from Pakistan and median male earnings in the United States with a correlation coefficient (R) of -0.419 and weighted average of $60,987, a difference of 25.1%.
Median Male Earnings Correlation Summary
| Measurement | Potawatomi | Immigrants from Pakistan |
| Minimum | $13,889 | $17,022 |
| Maximum | $66,032 | $81,734 |
| Range | $52,143 | $64,712 |
| Mean | $42,177 | $57,165 |
| Median | $42,915 | $59,890 |
| Interquartile 25% (IQ1) | $37,274 | $48,868 |
| Interquartile 75% (IQ3) | $48,416 | $64,399 |
| Interquartile Range (IQR) | $11,141 | $15,530 |
| Standard Deviation (Sample) | $10,408 | $11,844 |
| Standard Deviation (Population) | $10,305 | $11,755 |
Similar Demographics by Median Male Earnings
Demographics Similar to Potawatomi by Median Male Earnings
In terms of median male earnings, the demographic groups most similar to Potawatomi are Tsimshian ($48,836, a difference of 0.14%), Cherokee ($48,669, a difference of 0.20%), Salvadoran ($48,646, a difference of 0.25%), Ute ($48,899, a difference of 0.27%), and Jamaican ($48,632, a difference of 0.28%).
| Demographics | Rating | Rank | Median Male Earnings |
| Nicaraguans | 0.6 /100 | #263 | Tragic $49,215 |
| Immigrants | Middle Africa | 0.6 /100 | #264 | Tragic $49,201 |
| Immigrants | Laos | 0.6 /100 | #265 | Tragic $49,190 |
| Somalis | 0.5 /100 | #266 | Tragic $49,025 |
| Spanish Americans | 0.5 /100 | #267 | Tragic $49,008 |
| Ute | 0.4 /100 | #268 | Tragic $48,899 |
| Tsimshian | 0.4 /100 | #269 | Tragic $48,836 |
| Potawatomi | 0.4 /100 | #270 | Tragic $48,768 |
| Cherokee | 0.3 /100 | #271 | Tragic $48,669 |
| Salvadorans | 0.3 /100 | #272 | Tragic $48,646 |
| Jamaicans | 0.3 /100 | #273 | Tragic $48,632 |
| Colville | 0.3 /100 | #274 | Tragic $48,516 |
| Immigrants | Somalia | 0.3 /100 | #275 | Tragic $48,439 |
| Blackfeet | 0.3 /100 | #276 | Tragic $48,402 |
| Belizeans | 0.2 /100 | #277 | Tragic $48,358 |
Demographics Similar to Immigrants from Pakistan by Median Male Earnings
In terms of median male earnings, the demographic groups most similar to Immigrants from Pakistan are Immigrants from Eastern Europe ($60,958, a difference of 0.050%), Immigrants from Indonesia ($60,935, a difference of 0.080%), Immigrants from Romania ($61,040, a difference of 0.090%), Immigrants from Croatia ($60,914, a difference of 0.12%), and Bolivian ($61,066, a difference of 0.13%).
| Demographics | Rating | Rank | Median Male Earnings |
| Lithuanians | 99.9 /100 | #56 | Exceptional $61,228 |
| Immigrants | Scotland | 99.9 /100 | #57 | Exceptional $61,220 |
| New Zealanders | 99.9 /100 | #58 | Exceptional $61,199 |
| Immigrants | Netherlands | 99.8 /100 | #59 | Exceptional $61,096 |
| Egyptians | 99.8 /100 | #60 | Exceptional $61,095 |
| Bolivians | 99.8 /100 | #61 | Exceptional $61,066 |
| Immigrants | Romania | 99.8 /100 | #62 | Exceptional $61,040 |
| Immigrants | Pakistan | 99.8 /100 | #63 | Exceptional $60,987 |
| Immigrants | Eastern Europe | 99.8 /100 | #64 | Exceptional $60,958 |
| Immigrants | Indonesia | 99.8 /100 | #65 | Exceptional $60,935 |
| Immigrants | Croatia | 99.8 /100 | #66 | Exceptional $60,914 |
| Immigrants | Spain | 99.8 /100 | #67 | Exceptional $60,750 |
| Immigrants | Serbia | 99.7 /100 | #68 | Exceptional $60,600 |
| Immigrants | Canada | 99.7 /100 | #69 | Exceptional $60,388 |
| Immigrants | Bulgaria | 99.7 /100 | #70 | Exceptional $60,358 |