Potawatomi vs Samoan Median Male Earnings
COMPARE
Potawatomi
Samoan
Median Male Earnings
Median Male Earnings Comparison
Potawatomi
Samoans
$48,768
MEDIAN MALE EARNINGS
0.4/ 100
METRIC RATING
270th/ 347
METRIC RANK
$51,389
MEDIAN MALE EARNINGS
4.6/ 100
METRIC RATING
228th/ 347
METRIC RANK
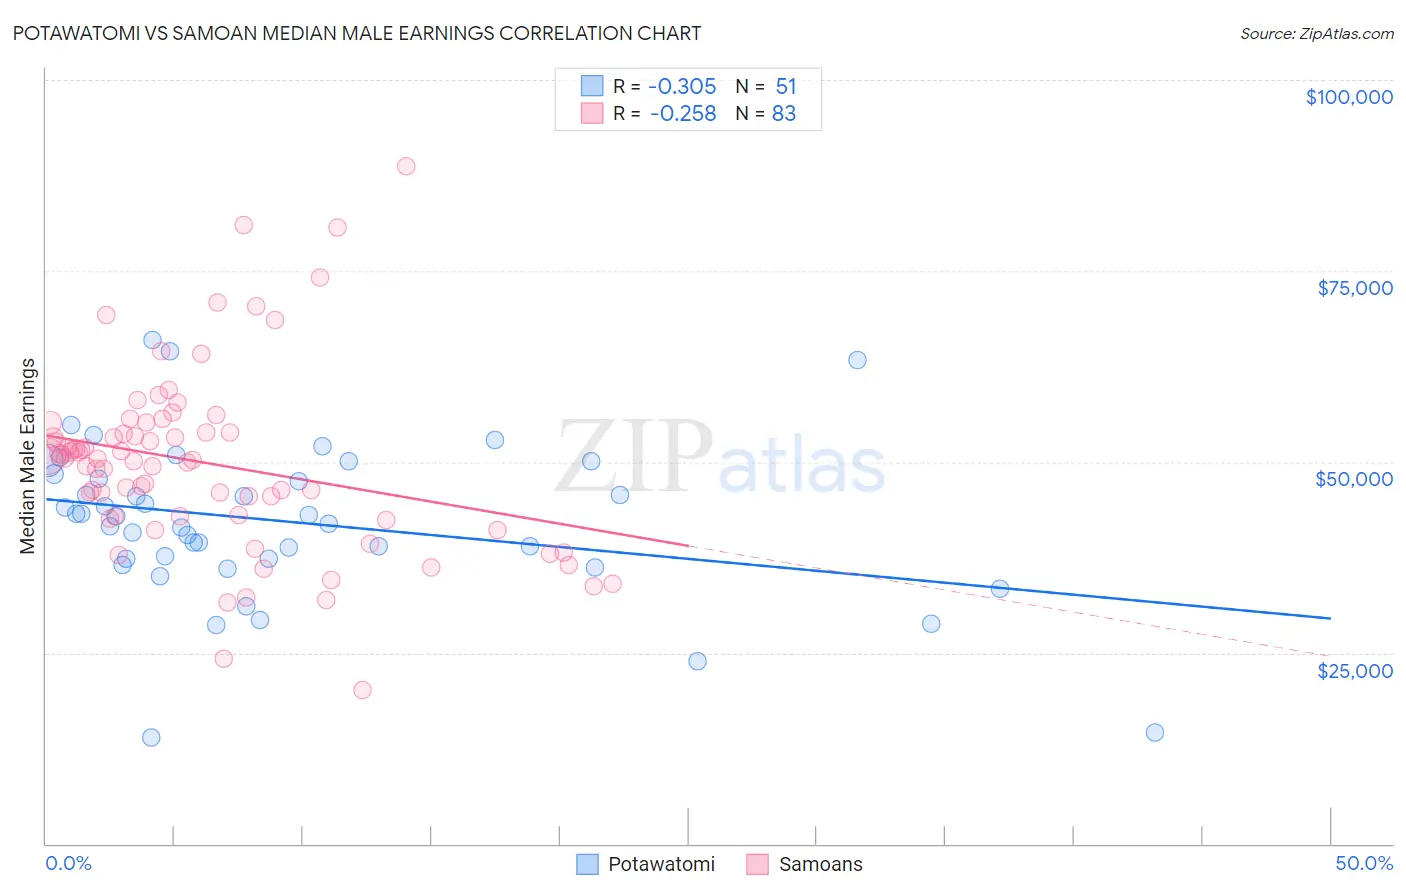
Potawatomi vs Samoan Median Male Earnings Correlation Chart
The statistical analysis conducted on geographies consisting of 117,758,062 people shows a mild negative correlation between the proportion of Potawatomi and median male earnings in the United States with a correlation coefficient (R) of -0.305 and weighted average of $48,768. Similarly, the statistical analysis conducted on geographies consisting of 225,157,304 people shows a weak negative correlation between the proportion of Samoans and median male earnings in the United States with a correlation coefficient (R) of -0.258 and weighted average of $51,389, a difference of 5.4%.
Median Male Earnings Correlation Summary
| Measurement | Potawatomi | Samoan |
| Minimum | $13,889 | $20,179 |
| Maximum | $66,032 | $88,750 |
| Range | $52,143 | $68,571 |
| Mean | $42,177 | $49,891 |
| Median | $42,915 | $50,415 |
| Interquartile 25% (IQ1) | $37,274 | $42,816 |
| Interquartile 75% (IQ3) | $48,416 | $53,887 |
| Interquartile Range (IQR) | $11,141 | $11,071 |
| Standard Deviation (Sample) | $10,408 | $11,942 |
| Standard Deviation (Population) | $10,305 | $11,870 |
Similar Demographics by Median Male Earnings
Demographics Similar to Potawatomi by Median Male Earnings
In terms of median male earnings, the demographic groups most similar to Potawatomi are Tsimshian ($48,836, a difference of 0.14%), Cherokee ($48,669, a difference of 0.20%), Salvadoran ($48,646, a difference of 0.25%), Ute ($48,899, a difference of 0.27%), and Jamaican ($48,632, a difference of 0.28%).
| Demographics | Rating | Rank | Median Male Earnings |
| Nicaraguans | 0.6 /100 | #263 | Tragic $49,215 |
| Immigrants | Middle Africa | 0.6 /100 | #264 | Tragic $49,201 |
| Immigrants | Laos | 0.6 /100 | #265 | Tragic $49,190 |
| Somalis | 0.5 /100 | #266 | Tragic $49,025 |
| Spanish Americans | 0.5 /100 | #267 | Tragic $49,008 |
| Ute | 0.4 /100 | #268 | Tragic $48,899 |
| Tsimshian | 0.4 /100 | #269 | Tragic $48,836 |
| Potawatomi | 0.4 /100 | #270 | Tragic $48,768 |
| Cherokee | 0.3 /100 | #271 | Tragic $48,669 |
| Salvadorans | 0.3 /100 | #272 | Tragic $48,646 |
| Jamaicans | 0.3 /100 | #273 | Tragic $48,632 |
| Colville | 0.3 /100 | #274 | Tragic $48,516 |
| Immigrants | Somalia | 0.3 /100 | #275 | Tragic $48,439 |
| Blackfeet | 0.3 /100 | #276 | Tragic $48,402 |
| Belizeans | 0.2 /100 | #277 | Tragic $48,358 |
Demographics Similar to Samoans by Median Male Earnings
In terms of median male earnings, the demographic groups most similar to Samoans are Immigrants from Trinidad and Tobago ($51,376, a difference of 0.030%), Trinidadian and Tobagonian ($51,446, a difference of 0.11%), Japanese ($51,473, a difference of 0.16%), Immigrants from Nigeria ($51,310, a difference of 0.16%), and Immigrants from Sudan ($51,489, a difference of 0.19%).
| Demographics | Rating | Rank | Median Male Earnings |
| Immigrants | Senegal | 5.8 /100 | #221 | Tragic $51,647 |
| Immigrants | Bangladesh | 5.8 /100 | #222 | Tragic $51,642 |
| Ecuadorians | 5.5 /100 | #223 | Tragic $51,596 |
| Immigrants | Cambodia | 5.5 /100 | #224 | Tragic $51,594 |
| Immigrants | Sudan | 5.0 /100 | #225 | Tragic $51,489 |
| Japanese | 4.9 /100 | #226 | Tragic $51,473 |
| Trinidadians and Tobagonians | 4.8 /100 | #227 | Tragic $51,446 |
| Samoans | 4.6 /100 | #228 | Tragic $51,389 |
| Immigrants | Trinidad and Tobago | 4.5 /100 | #229 | Tragic $51,376 |
| Immigrants | Nigeria | 4.2 /100 | #230 | Tragic $51,310 |
| Barbadians | 3.9 /100 | #231 | Tragic $51,236 |
| Sudanese | 3.9 /100 | #232 | Tragic $51,216 |
| Aleuts | 3.7 /100 | #233 | Tragic $51,168 |
| Cape Verdeans | 3.5 /100 | #234 | Tragic $51,103 |
| Immigrants | Western Africa | 3.0 /100 | #235 | Tragic $50,940 |