Potawatomi vs Immigrants from Jamaica Median Male Earnings
COMPARE
Potawatomi
Immigrants from Jamaica
Median Male Earnings
Median Male Earnings Comparison
Potawatomi
Immigrants from Jamaica
$48,768
MEDIAN MALE EARNINGS
0.4/ 100
METRIC RATING
270th/ 347
METRIC RANK
$48,040
MEDIAN MALE EARNINGS
0.2/ 100
METRIC RATING
283rd/ 347
METRIC RANK
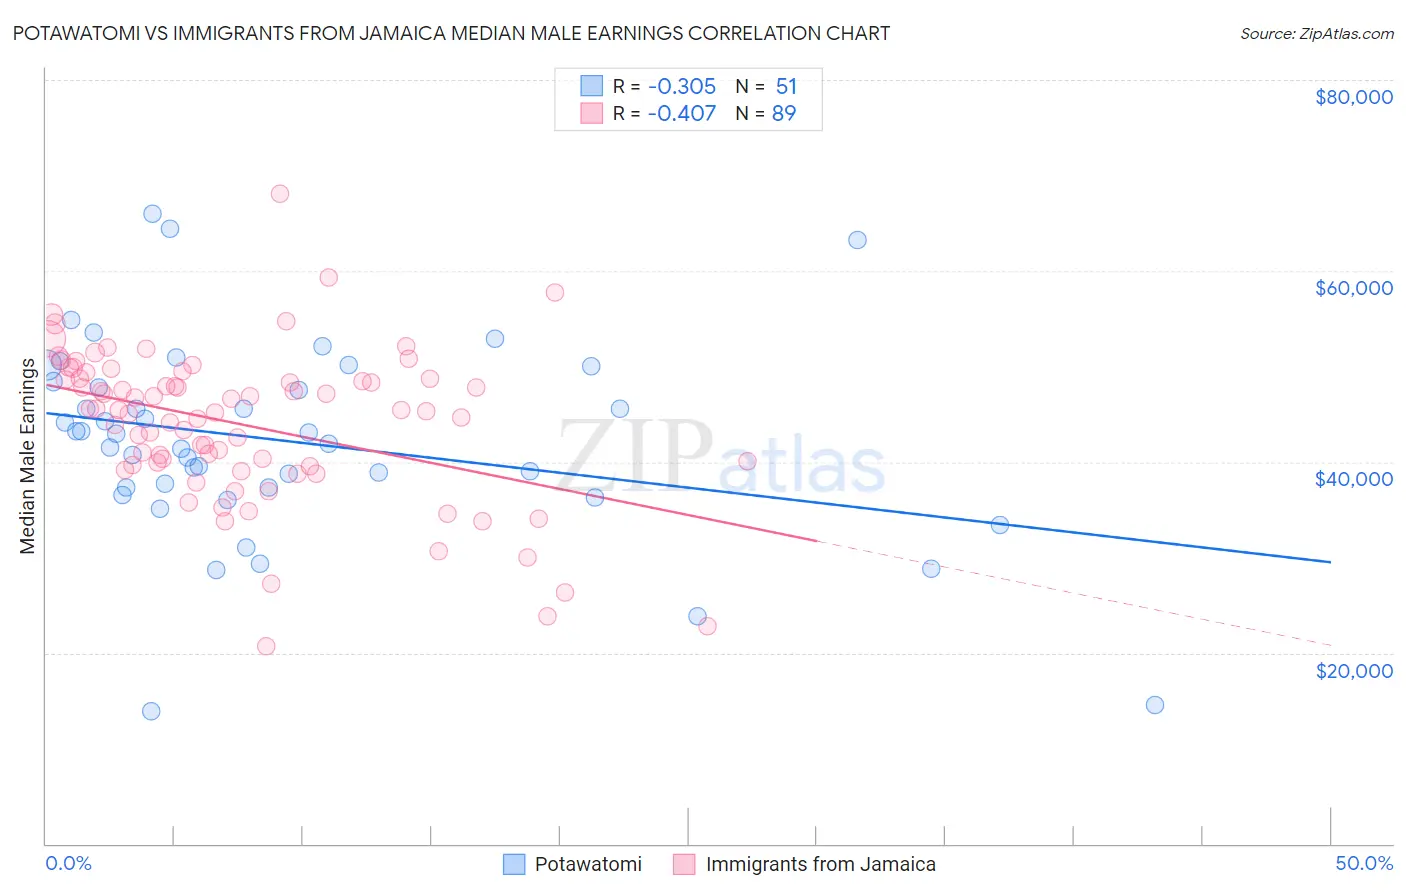
Potawatomi vs Immigrants from Jamaica Median Male Earnings Correlation Chart
The statistical analysis conducted on geographies consisting of 117,758,062 people shows a mild negative correlation between the proportion of Potawatomi and median male earnings in the United States with a correlation coefficient (R) of -0.305 and weighted average of $48,768. Similarly, the statistical analysis conducted on geographies consisting of 301,762,663 people shows a moderate negative correlation between the proportion of Immigrants from Jamaica and median male earnings in the United States with a correlation coefficient (R) of -0.407 and weighted average of $48,040, a difference of 1.5%.
Median Male Earnings Correlation Summary
| Measurement | Potawatomi | Immigrants from Jamaica |
| Minimum | $13,889 | $20,648 |
| Maximum | $66,032 | $68,125 |
| Range | $52,143 | $47,477 |
| Mean | $42,177 | $43,924 |
| Median | $42,915 | $45,397 |
| Interquartile 25% (IQ1) | $37,274 | $39,601 |
| Interquartile 75% (IQ3) | $48,416 | $48,697 |
| Interquartile Range (IQR) | $11,141 | $9,096 |
| Standard Deviation (Sample) | $10,408 | $8,088 |
| Standard Deviation (Population) | $10,305 | $8,042 |
Demographics Similar to Potawatomi and Immigrants from Jamaica by Median Male Earnings
In terms of median male earnings, the demographic groups most similar to Potawatomi are Tsimshian ($48,836, a difference of 0.14%), Cherokee ($48,669, a difference of 0.20%), Salvadoran ($48,646, a difference of 0.25%), Ute ($48,899, a difference of 0.27%), and Jamaican ($48,632, a difference of 0.28%). Similarly, the demographic groups most similar to Immigrants from Jamaica are African ($47,994, a difference of 0.090%), Paiute ($47,991, a difference of 0.10%), Mexican American Indian ($47,990, a difference of 0.10%), Central American ($48,093, a difference of 0.11%), and Marshallese ($48,137, a difference of 0.20%).
| Demographics | Rating | Rank | Median Male Earnings |
| Somalis | 0.5 /100 | #266 | Tragic $49,025 |
| Spanish Americans | 0.5 /100 | #267 | Tragic $49,008 |
| Ute | 0.4 /100 | #268 | Tragic $48,899 |
| Tsimshian | 0.4 /100 | #269 | Tragic $48,836 |
| Potawatomi | 0.4 /100 | #270 | Tragic $48,768 |
| Cherokee | 0.3 /100 | #271 | Tragic $48,669 |
| Salvadorans | 0.3 /100 | #272 | Tragic $48,646 |
| Jamaicans | 0.3 /100 | #273 | Tragic $48,632 |
| Colville | 0.3 /100 | #274 | Tragic $48,516 |
| Immigrants | Somalia | 0.3 /100 | #275 | Tragic $48,439 |
| Blackfeet | 0.3 /100 | #276 | Tragic $48,402 |
| Belizeans | 0.2 /100 | #277 | Tragic $48,358 |
| Immigrants | Liberia | 0.2 /100 | #278 | Tragic $48,317 |
| Hmong | 0.2 /100 | #279 | Tragic $48,254 |
| Comanche | 0.2 /100 | #280 | Tragic $48,202 |
| Marshallese | 0.2 /100 | #281 | Tragic $48,137 |
| Central Americans | 0.2 /100 | #282 | Tragic $48,093 |
| Immigrants | Jamaica | 0.2 /100 | #283 | Tragic $48,040 |
| Africans | 0.2 /100 | #284 | Tragic $47,994 |
| Paiute | 0.2 /100 | #285 | Tragic $47,991 |
| Mexican American Indians | 0.2 /100 | #286 | Tragic $47,990 |