Potawatomi vs Slovak Median Male Earnings
COMPARE
Potawatomi
Slovak
Median Male Earnings
Median Male Earnings Comparison
Potawatomi
Slovaks
$48,768
MEDIAN MALE EARNINGS
0.4/ 100
METRIC RATING
270th/ 347
METRIC RANK
$56,306
MEDIAN MALE EARNINGS
85.5/ 100
METRIC RATING
138th/ 347
METRIC RANK
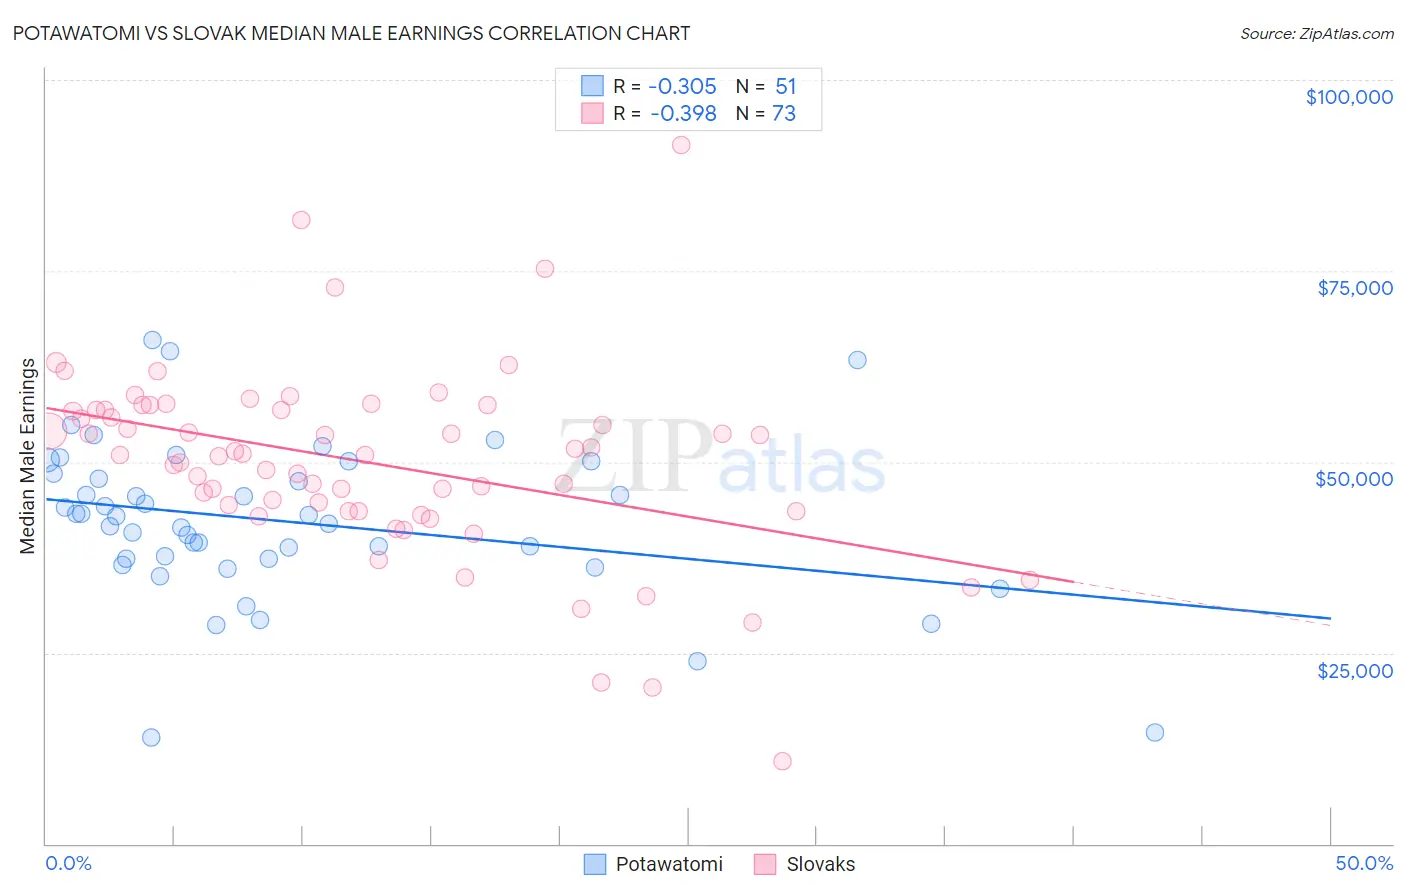
Potawatomi vs Slovak Median Male Earnings Correlation Chart
The statistical analysis conducted on geographies consisting of 117,758,062 people shows a mild negative correlation between the proportion of Potawatomi and median male earnings in the United States with a correlation coefficient (R) of -0.305 and weighted average of $48,768. Similarly, the statistical analysis conducted on geographies consisting of 397,698,254 people shows a mild negative correlation between the proportion of Slovaks and median male earnings in the United States with a correlation coefficient (R) of -0.398 and weighted average of $56,306, a difference of 15.5%.
Median Male Earnings Correlation Summary
| Measurement | Potawatomi | Slovak |
| Minimum | $13,889 | $10,727 |
| Maximum | $66,032 | $91,563 |
| Range | $52,143 | $80,836 |
| Mean | $42,177 | $49,965 |
| Median | $42,915 | $50,933 |
| Interquartile 25% (IQ1) | $37,274 | $43,560 |
| Interquartile 75% (IQ3) | $48,416 | $56,815 |
| Interquartile Range (IQR) | $11,141 | $13,254 |
| Standard Deviation (Sample) | $10,408 | $12,608 |
| Standard Deviation (Population) | $10,305 | $12,522 |
Similar Demographics by Median Male Earnings
Demographics Similar to Potawatomi by Median Male Earnings
In terms of median male earnings, the demographic groups most similar to Potawatomi are Tsimshian ($48,836, a difference of 0.14%), Cherokee ($48,669, a difference of 0.20%), Salvadoran ($48,646, a difference of 0.25%), Ute ($48,899, a difference of 0.27%), and Jamaican ($48,632, a difference of 0.28%).
| Demographics | Rating | Rank | Median Male Earnings |
| Nicaraguans | 0.6 /100 | #263 | Tragic $49,215 |
| Immigrants | Middle Africa | 0.6 /100 | #264 | Tragic $49,201 |
| Immigrants | Laos | 0.6 /100 | #265 | Tragic $49,190 |
| Somalis | 0.5 /100 | #266 | Tragic $49,025 |
| Spanish Americans | 0.5 /100 | #267 | Tragic $49,008 |
| Ute | 0.4 /100 | #268 | Tragic $48,899 |
| Tsimshian | 0.4 /100 | #269 | Tragic $48,836 |
| Potawatomi | 0.4 /100 | #270 | Tragic $48,768 |
| Cherokee | 0.3 /100 | #271 | Tragic $48,669 |
| Salvadorans | 0.3 /100 | #272 | Tragic $48,646 |
| Jamaicans | 0.3 /100 | #273 | Tragic $48,632 |
| Colville | 0.3 /100 | #274 | Tragic $48,516 |
| Immigrants | Somalia | 0.3 /100 | #275 | Tragic $48,439 |
| Blackfeet | 0.3 /100 | #276 | Tragic $48,402 |
| Belizeans | 0.2 /100 | #277 | Tragic $48,358 |
Demographics Similar to Slovaks by Median Male Earnings
In terms of median male earnings, the demographic groups most similar to Slovaks are Zimbabwean ($56,302, a difference of 0.010%), Luxembourger ($56,300, a difference of 0.010%), Danish ($56,246, a difference of 0.11%), Ethiopian ($56,243, a difference of 0.11%), and Slavic ($56,390, a difference of 0.15%).
| Demographics | Rating | Rank | Median Male Earnings |
| Portuguese | 89.4 /100 | #131 | Excellent $56,663 |
| Czechs | 88.2 /100 | #132 | Excellent $56,546 |
| Immigrants | Germany | 88.2 /100 | #133 | Excellent $56,542 |
| Moroccans | 87.7 /100 | #134 | Excellent $56,499 |
| Irish | 87.4 /100 | #135 | Excellent $56,464 |
| Immigrants | Saudi Arabia | 87.2 /100 | #136 | Excellent $56,452 |
| Slavs | 86.5 /100 | #137 | Excellent $56,390 |
| Slovaks | 85.5 /100 | #138 | Excellent $56,306 |
| Zimbabweans | 85.5 /100 | #139 | Excellent $56,302 |
| Luxembourgers | 85.5 /100 | #140 | Excellent $56,300 |
| Danes | 84.8 /100 | #141 | Excellent $56,246 |
| Ethiopians | 84.8 /100 | #142 | Excellent $56,243 |
| Sri Lankans | 83.4 /100 | #143 | Excellent $56,136 |
| Immigrants | Uganda | 82.4 /100 | #144 | Excellent $56,064 |
| Norwegians | 80.9 /100 | #145 | Excellent $55,965 |