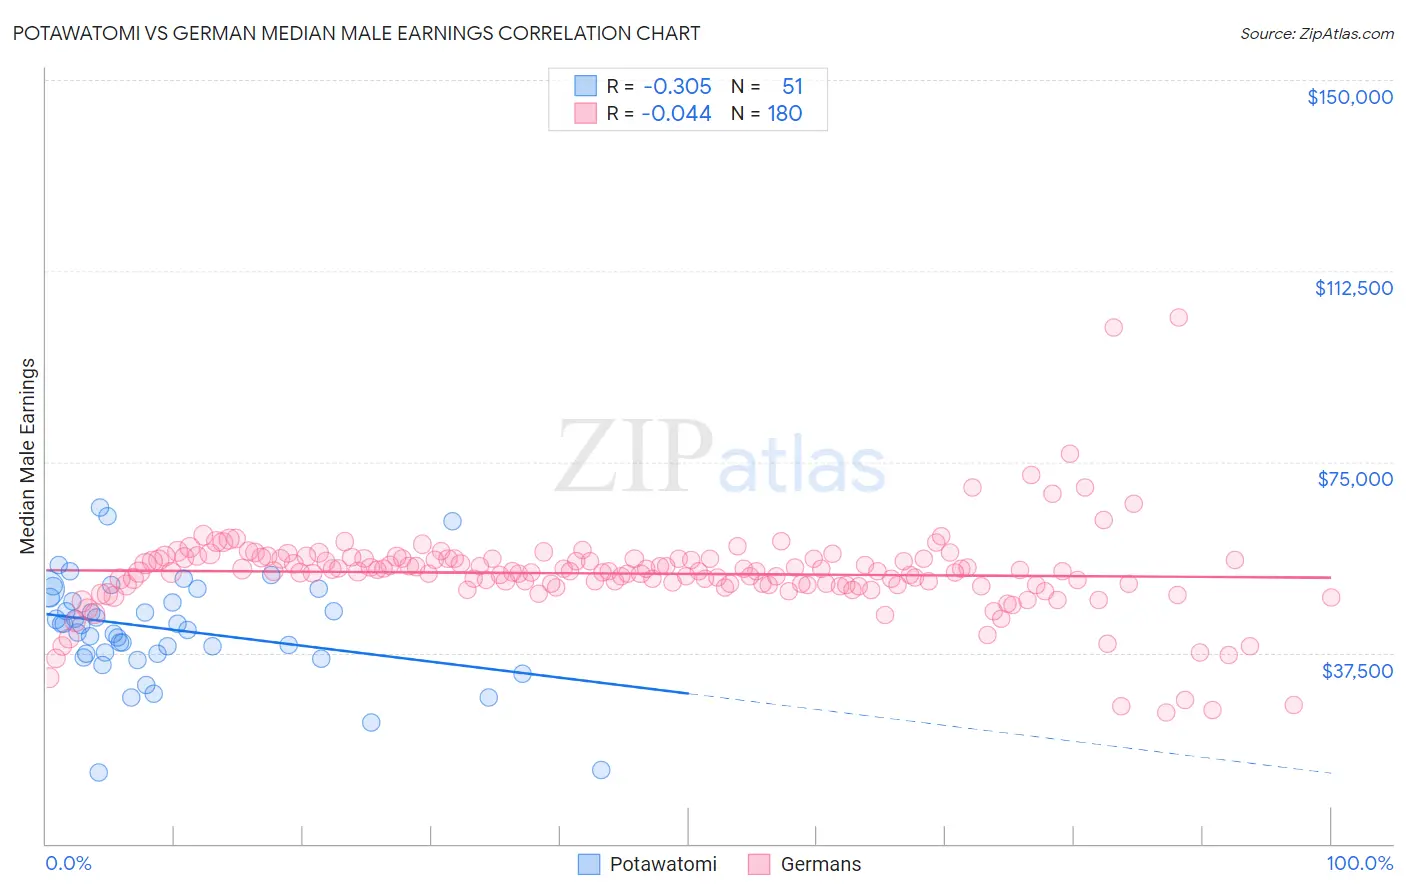
Potawatomi vs German Median Male Earnings
COMPARE
Potawatomi
German
Median Male Earnings
Median Male Earnings Comparison
Potawatomi
Germans
$48,768
MEDIAN MALE EARNINGS
0.4/ 100
METRIC RATING
270th/ 347
METRIC RANK
$54,974
MEDIAN MALE EARNINGS
61.6/ 100
METRIC RATING
166th/ 347
METRIC RANK
Potawatomi vs German Median Male Earnings Correlation Chart
The statistical analysis conducted on geographies consisting of 117,758,062 people shows a mild negative correlation between the proportion of Potawatomi and median male earnings in the United States with a correlation coefficient (R) of -0.305 and weighted average of $48,768. Similarly, the statistical analysis conducted on geographies consisting of 579,097,396 people shows no correlation between the proportion of Germans and median male earnings in the United States with a correlation coefficient (R) of -0.044 and weighted average of $54,974, a difference of 12.7%.
Median Male Earnings Correlation Summary
| Measurement | Potawatomi | German |
| Minimum | $13,889 | $25,882 |
| Maximum | $66,032 | $103,432 |
| Range | $52,143 | $77,550 |
| Mean | $42,177 | $53,076 |
| Median | $42,915 | $53,458 |
| Interquartile 25% (IQ1) | $37,274 | $50,831 |
| Interquartile 75% (IQ3) | $48,416 | $56,007 |
| Interquartile Range (IQR) | $11,141 | $5,176 |
| Standard Deviation (Sample) | $10,408 | $8,925 |
| Standard Deviation (Population) | $10,305 | $8,900 |
Similar Demographics by Median Male Earnings
Demographics Similar to Potawatomi by Median Male Earnings
In terms of median male earnings, the demographic groups most similar to Potawatomi are Tsimshian ($48,836, a difference of 0.14%), Cherokee ($48,669, a difference of 0.20%), Salvadoran ($48,646, a difference of 0.25%), Ute ($48,899, a difference of 0.27%), and Jamaican ($48,632, a difference of 0.28%).
| Demographics | Rating | Rank | Median Male Earnings |
| Nicaraguans | 0.6 /100 | #263 | Tragic $49,215 |
| Immigrants | Middle Africa | 0.6 /100 | #264 | Tragic $49,201 |
| Immigrants | Laos | 0.6 /100 | #265 | Tragic $49,190 |
| Somalis | 0.5 /100 | #266 | Tragic $49,025 |
| Spanish Americans | 0.5 /100 | #267 | Tragic $49,008 |
| Ute | 0.4 /100 | #268 | Tragic $48,899 |
| Tsimshian | 0.4 /100 | #269 | Tragic $48,836 |
| Potawatomi | 0.4 /100 | #270 | Tragic $48,768 |
| Cherokee | 0.3 /100 | #271 | Tragic $48,669 |
| Salvadorans | 0.3 /100 | #272 | Tragic $48,646 |
| Jamaicans | 0.3 /100 | #273 | Tragic $48,632 |
| Colville | 0.3 /100 | #274 | Tragic $48,516 |
| Immigrants | Somalia | 0.3 /100 | #275 | Tragic $48,439 |
| Blackfeet | 0.3 /100 | #276 | Tragic $48,402 |
| Belizeans | 0.2 /100 | #277 | Tragic $48,358 |
Demographics Similar to Germans by Median Male Earnings
In terms of median male earnings, the demographic groups most similar to Germans are Immigrants from Fiji ($54,958, a difference of 0.030%), Immigrants from Vietnam ($54,913, a difference of 0.11%), Immigrants from Portugal ($55,182, a difference of 0.38%), French Canadian ($54,722, a difference of 0.46%), and Finnish ($54,721, a difference of 0.46%).
| Demographics | Rating | Rank | Median Male Earnings |
| Alsatians | 70.5 /100 | #159 | Good $55,380 |
| Basques | 70.3 /100 | #160 | Good $55,370 |
| Belgians | 70.1 /100 | #161 | Good $55,361 |
| French | 69.9 /100 | #162 | Good $55,350 |
| Ugandans | 68.6 /100 | #163 | Good $55,290 |
| Immigrants | South Eastern Asia | 67.6 /100 | #164 | Good $55,241 |
| Immigrants | Portugal | 66.3 /100 | #165 | Good $55,182 |
| Germans | 61.6 /100 | #166 | Good $54,974 |
| Immigrants | Fiji | 61.2 /100 | #167 | Good $54,958 |
| Immigrants | Vietnam | 60.2 /100 | #168 | Good $54,913 |
| French Canadians | 55.6 /100 | #169 | Average $54,722 |
| Finns | 55.6 /100 | #170 | Average $54,721 |
| Immigrants | Peru | 54.9 /100 | #171 | Average $54,695 |
| Welsh | 53.8 /100 | #172 | Average $54,647 |
| South American Indians | 50.4 /100 | #173 | Average $54,508 |