German Russian vs Immigrants from Pakistan Median Male Earnings
COMPARE
German Russian
Immigrants from Pakistan
Median Male Earnings
Median Male Earnings Comparison
German Russians
Immigrants from Pakistan
$49,924
MEDIAN MALE EARNINGS
1.1/ 100
METRIC RATING
253rd/ 347
METRIC RANK
$60,987
MEDIAN MALE EARNINGS
99.8/ 100
METRIC RATING
63rd/ 347
METRIC RANK
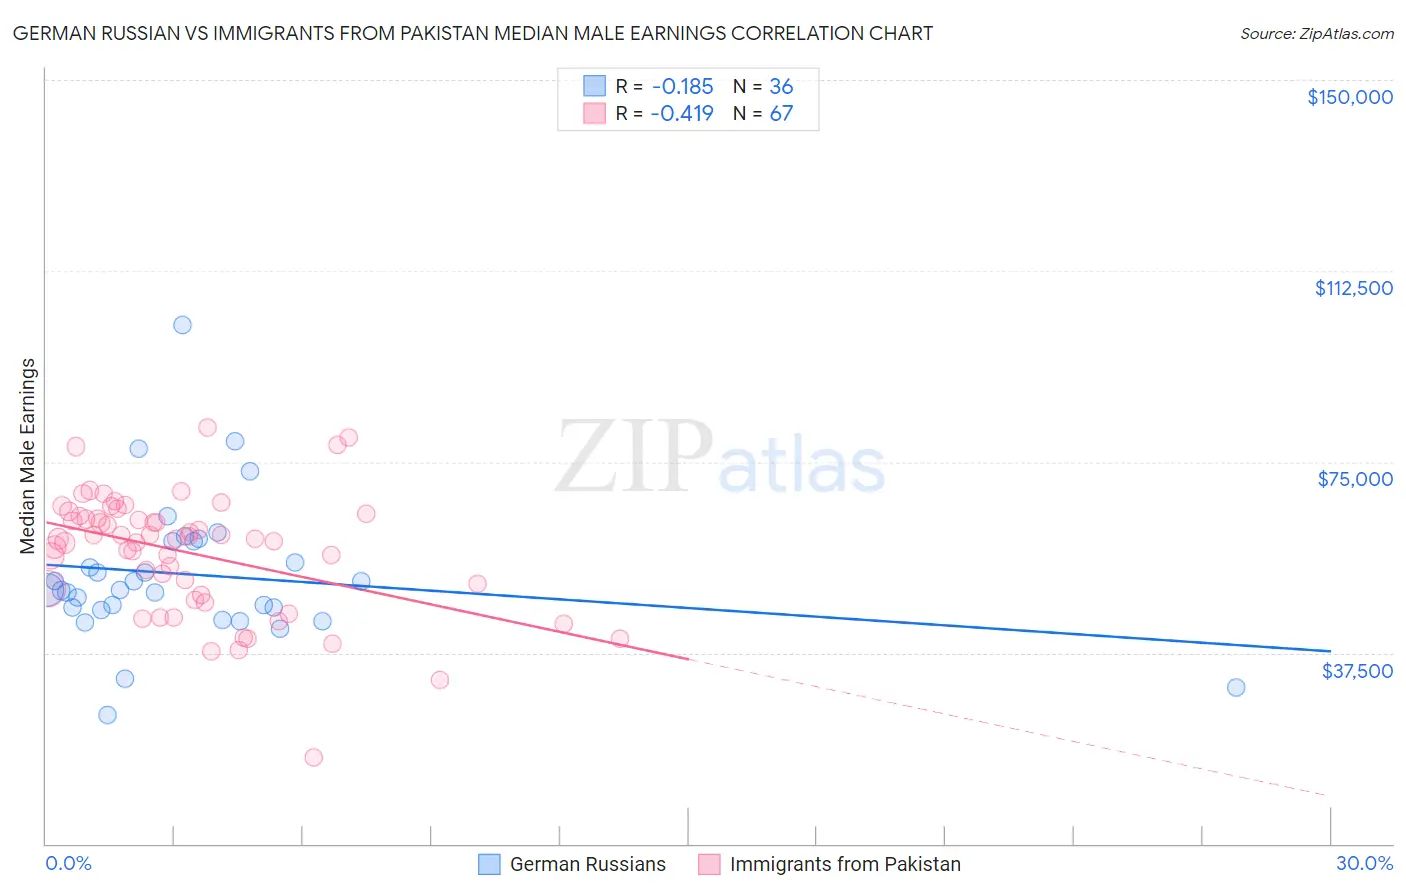
German Russian vs Immigrants from Pakistan Median Male Earnings Correlation Chart
The statistical analysis conducted on geographies consisting of 96,455,245 people shows a poor negative correlation between the proportion of German Russians and median male earnings in the United States with a correlation coefficient (R) of -0.185 and weighted average of $49,924. Similarly, the statistical analysis conducted on geographies consisting of 283,803,511 people shows a moderate negative correlation between the proportion of Immigrants from Pakistan and median male earnings in the United States with a correlation coefficient (R) of -0.419 and weighted average of $60,987, a difference of 22.2%.
Median Male Earnings Correlation Summary
| Measurement | German Russian | Immigrants from Pakistan |
| Minimum | $25,295 | $17,022 |
| Maximum | $101,964 | $81,734 |
| Range | $76,669 | $64,712 |
| Mean | $52,820 | $57,165 |
| Median | $49,866 | $59,890 |
| Interquartile 25% (IQ1) | $46,118 | $48,868 |
| Interquartile 75% (IQ3) | $59,385 | $64,399 |
| Interquartile Range (IQR) | $13,267 | $15,530 |
| Standard Deviation (Sample) | $14,069 | $11,844 |
| Standard Deviation (Population) | $13,873 | $11,755 |
Similar Demographics by Median Male Earnings
Demographics Similar to German Russians by Median Male Earnings
In terms of median male earnings, the demographic groups most similar to German Russians are Immigrants from Cabo Verde ($50,009, a difference of 0.17%), Senegalese ($49,774, a difference of 0.30%), Alaskan Athabascan ($49,748, a difference of 0.35%), Alaska Native ($49,711, a difference of 0.43%), and British West Indian ($49,636, a difference of 0.58%).
| Demographics | Rating | Rank | Median Male Earnings |
| Immigrants | Ecuador | 1.9 /100 | #246 | Tragic $50,474 |
| Sub-Saharan Africans | 1.8 /100 | #247 | Tragic $50,408 |
| Immigrants | Guyana | 1.6 /100 | #248 | Tragic $50,321 |
| Immigrants | Burma/Myanmar | 1.6 /100 | #249 | Tragic $50,298 |
| Osage | 1.6 /100 | #250 | Tragic $50,292 |
| Immigrants | Grenada | 1.6 /100 | #251 | Tragic $50,279 |
| Immigrants | Cabo Verde | 1.2 /100 | #252 | Tragic $50,009 |
| German Russians | 1.1 /100 | #253 | Tragic $49,924 |
| Senegalese | 1.0 /100 | #254 | Tragic $49,774 |
| Alaskan Athabascans | 0.9 /100 | #255 | Tragic $49,748 |
| Alaska Natives | 0.9 /100 | #256 | Tragic $49,711 |
| British West Indians | 0.8 /100 | #257 | Tragic $49,636 |
| Cree | 0.7 /100 | #258 | Tragic $49,497 |
| Nepalese | 0.7 /100 | #259 | Tragic $49,458 |
| Iroquois | 0.7 /100 | #260 | Tragic $49,374 |
Demographics Similar to Immigrants from Pakistan by Median Male Earnings
In terms of median male earnings, the demographic groups most similar to Immigrants from Pakistan are Immigrants from Eastern Europe ($60,958, a difference of 0.050%), Immigrants from Indonesia ($60,935, a difference of 0.080%), Immigrants from Romania ($61,040, a difference of 0.090%), Immigrants from Croatia ($60,914, a difference of 0.12%), and Bolivian ($61,066, a difference of 0.13%).
| Demographics | Rating | Rank | Median Male Earnings |
| Lithuanians | 99.9 /100 | #56 | Exceptional $61,228 |
| Immigrants | Scotland | 99.9 /100 | #57 | Exceptional $61,220 |
| New Zealanders | 99.9 /100 | #58 | Exceptional $61,199 |
| Immigrants | Netherlands | 99.8 /100 | #59 | Exceptional $61,096 |
| Egyptians | 99.8 /100 | #60 | Exceptional $61,095 |
| Bolivians | 99.8 /100 | #61 | Exceptional $61,066 |
| Immigrants | Romania | 99.8 /100 | #62 | Exceptional $61,040 |
| Immigrants | Pakistan | 99.8 /100 | #63 | Exceptional $60,987 |
| Immigrants | Eastern Europe | 99.8 /100 | #64 | Exceptional $60,958 |
| Immigrants | Indonesia | 99.8 /100 | #65 | Exceptional $60,935 |
| Immigrants | Croatia | 99.8 /100 | #66 | Exceptional $60,914 |
| Immigrants | Spain | 99.8 /100 | #67 | Exceptional $60,750 |
| Immigrants | Serbia | 99.7 /100 | #68 | Exceptional $60,600 |
| Immigrants | Canada | 99.7 /100 | #69 | Exceptional $60,388 |
| Immigrants | Bulgaria | 99.7 /100 | #70 | Exceptional $60,358 |