Potawatomi vs Immigrants from Taiwan Median Male Earnings
COMPARE
Potawatomi
Immigrants from Taiwan
Median Male Earnings
Median Male Earnings Comparison
Potawatomi
Immigrants from Taiwan
$48,768
MEDIAN MALE EARNINGS
0.4/ 100
METRIC RATING
270th/ 347
METRIC RANK
$74,031
MEDIAN MALE EARNINGS
100.0/ 100
METRIC RATING
3rd/ 347
METRIC RANK
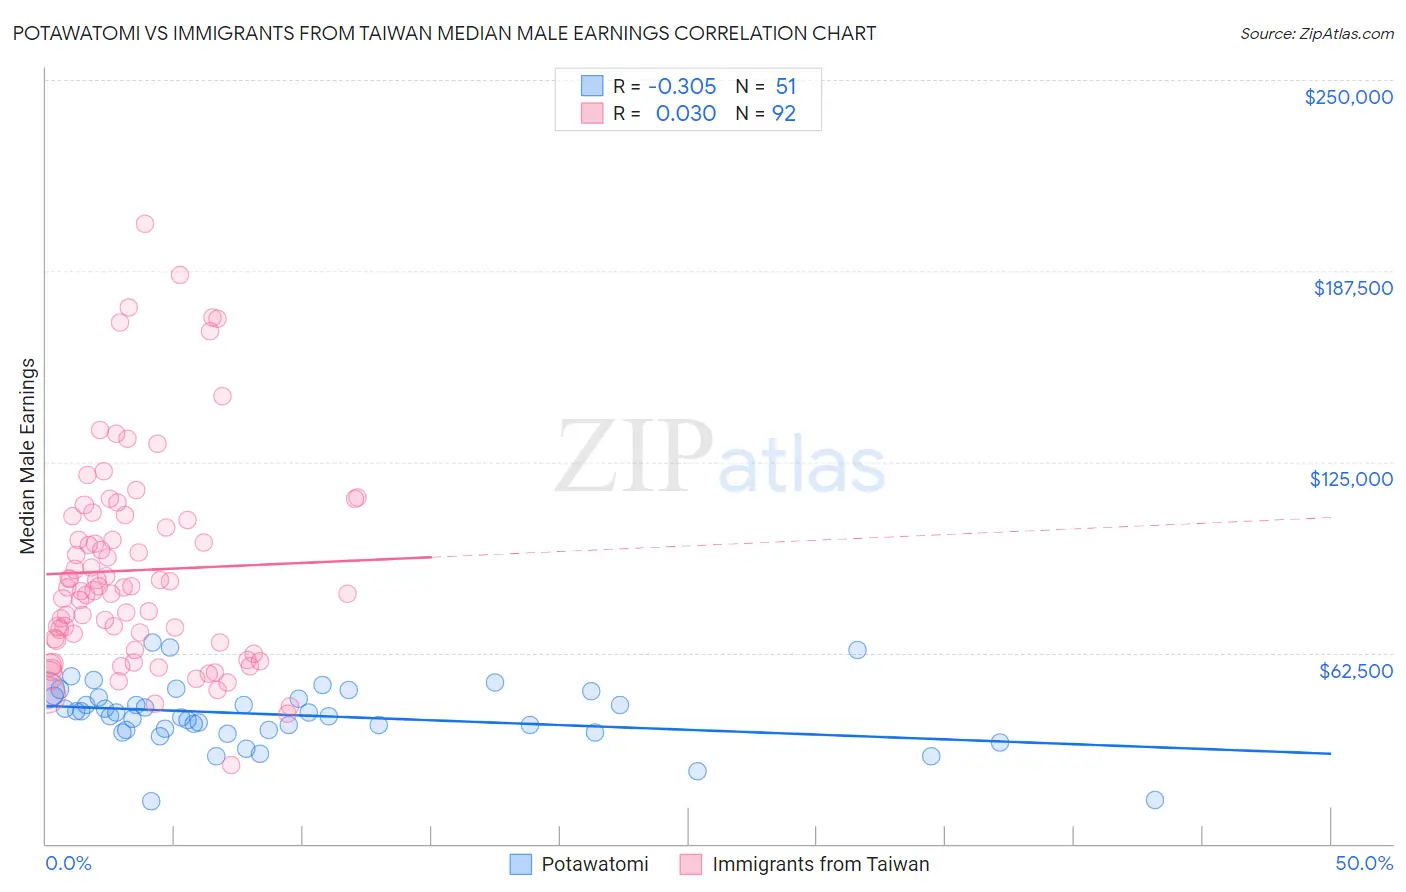
Potawatomi vs Immigrants from Taiwan Median Male Earnings Correlation Chart
The statistical analysis conducted on geographies consisting of 117,758,062 people shows a mild negative correlation between the proportion of Potawatomi and median male earnings in the United States with a correlation coefficient (R) of -0.305 and weighted average of $48,768. Similarly, the statistical analysis conducted on geographies consisting of 298,261,380 people shows no correlation between the proportion of Immigrants from Taiwan and median male earnings in the United States with a correlation coefficient (R) of 0.030 and weighted average of $74,031, a difference of 51.8%.
Median Male Earnings Correlation Summary
| Measurement | Potawatomi | Immigrants from Taiwan |
| Minimum | $13,889 | $25,921 |
| Maximum | $66,032 | $202,837 |
| Range | $52,143 | $176,916 |
| Mean | $42,177 | $89,558 |
| Median | $42,915 | $83,311 |
| Interquartile 25% (IQ1) | $37,274 | $64,686 |
| Interquartile 75% (IQ3) | $48,416 | $106,599 |
| Interquartile Range (IQR) | $11,141 | $41,914 |
| Standard Deviation (Sample) | $10,408 | $34,934 |
| Standard Deviation (Population) | $10,305 | $34,744 |
Similar Demographics by Median Male Earnings
Demographics Similar to Potawatomi by Median Male Earnings
In terms of median male earnings, the demographic groups most similar to Potawatomi are Tsimshian ($48,836, a difference of 0.14%), Cherokee ($48,669, a difference of 0.20%), Salvadoran ($48,646, a difference of 0.25%), Ute ($48,899, a difference of 0.27%), and Jamaican ($48,632, a difference of 0.28%).
| Demographics | Rating | Rank | Median Male Earnings |
| Nicaraguans | 0.6 /100 | #263 | Tragic $49,215 |
| Immigrants | Middle Africa | 0.6 /100 | #264 | Tragic $49,201 |
| Immigrants | Laos | 0.6 /100 | #265 | Tragic $49,190 |
| Somalis | 0.5 /100 | #266 | Tragic $49,025 |
| Spanish Americans | 0.5 /100 | #267 | Tragic $49,008 |
| Ute | 0.4 /100 | #268 | Tragic $48,899 |
| Tsimshian | 0.4 /100 | #269 | Tragic $48,836 |
| Potawatomi | 0.4 /100 | #270 | Tragic $48,768 |
| Cherokee | 0.3 /100 | #271 | Tragic $48,669 |
| Salvadorans | 0.3 /100 | #272 | Tragic $48,646 |
| Jamaicans | 0.3 /100 | #273 | Tragic $48,632 |
| Colville | 0.3 /100 | #274 | Tragic $48,516 |
| Immigrants | Somalia | 0.3 /100 | #275 | Tragic $48,439 |
| Blackfeet | 0.3 /100 | #276 | Tragic $48,402 |
| Belizeans | 0.2 /100 | #277 | Tragic $48,358 |
Demographics Similar to Immigrants from Taiwan by Median Male Earnings
In terms of median male earnings, the demographic groups most similar to Immigrants from Taiwan are Immigrants from India ($74,207, a difference of 0.24%), Filipino ($74,224, a difference of 0.26%), Thai ($72,135, a difference of 2.6%), Immigrants from Singapore ($71,348, a difference of 3.8%), and Iranian ($70,648, a difference of 4.8%).
| Demographics | Rating | Rank | Median Male Earnings |
| Filipinos | 100.0 /100 | #1 | Exceptional $74,224 |
| Immigrants | India | 100.0 /100 | #2 | Exceptional $74,207 |
| Immigrants | Taiwan | 100.0 /100 | #3 | Exceptional $74,031 |
| Thais | 100.0 /100 | #4 | Exceptional $72,135 |
| Immigrants | Singapore | 100.0 /100 | #5 | Exceptional $71,348 |
| Iranians | 100.0 /100 | #6 | Exceptional $70,648 |
| Immigrants | Hong Kong | 100.0 /100 | #7 | Exceptional $70,146 |
| Immigrants | Iran | 100.0 /100 | #8 | Exceptional $69,284 |
| Immigrants | South Central Asia | 100.0 /100 | #9 | Exceptional $68,960 |
| Immigrants | Israel | 100.0 /100 | #10 | Exceptional $68,716 |
| Immigrants | Ireland | 100.0 /100 | #11 | Exceptional $67,698 |
| Immigrants | Australia | 100.0 /100 | #12 | Exceptional $67,634 |
| Immigrants | China | 100.0 /100 | #13 | Exceptional $67,353 |
| Okinawans | 100.0 /100 | #14 | Exceptional $67,232 |
| Immigrants | Eastern Asia | 100.0 /100 | #15 | Exceptional $66,903 |