Panamanian vs Immigrants from Pakistan Median Male Earnings
COMPARE
Panamanian
Immigrants from Pakistan
Median Male Earnings
Median Male Earnings Comparison
Panamanians
Immigrants from Pakistan
$52,835
MEDIAN MALE EARNINGS
16.5/ 100
METRIC RATING
203rd/ 347
METRIC RANK
$60,987
MEDIAN MALE EARNINGS
99.8/ 100
METRIC RATING
63rd/ 347
METRIC RANK
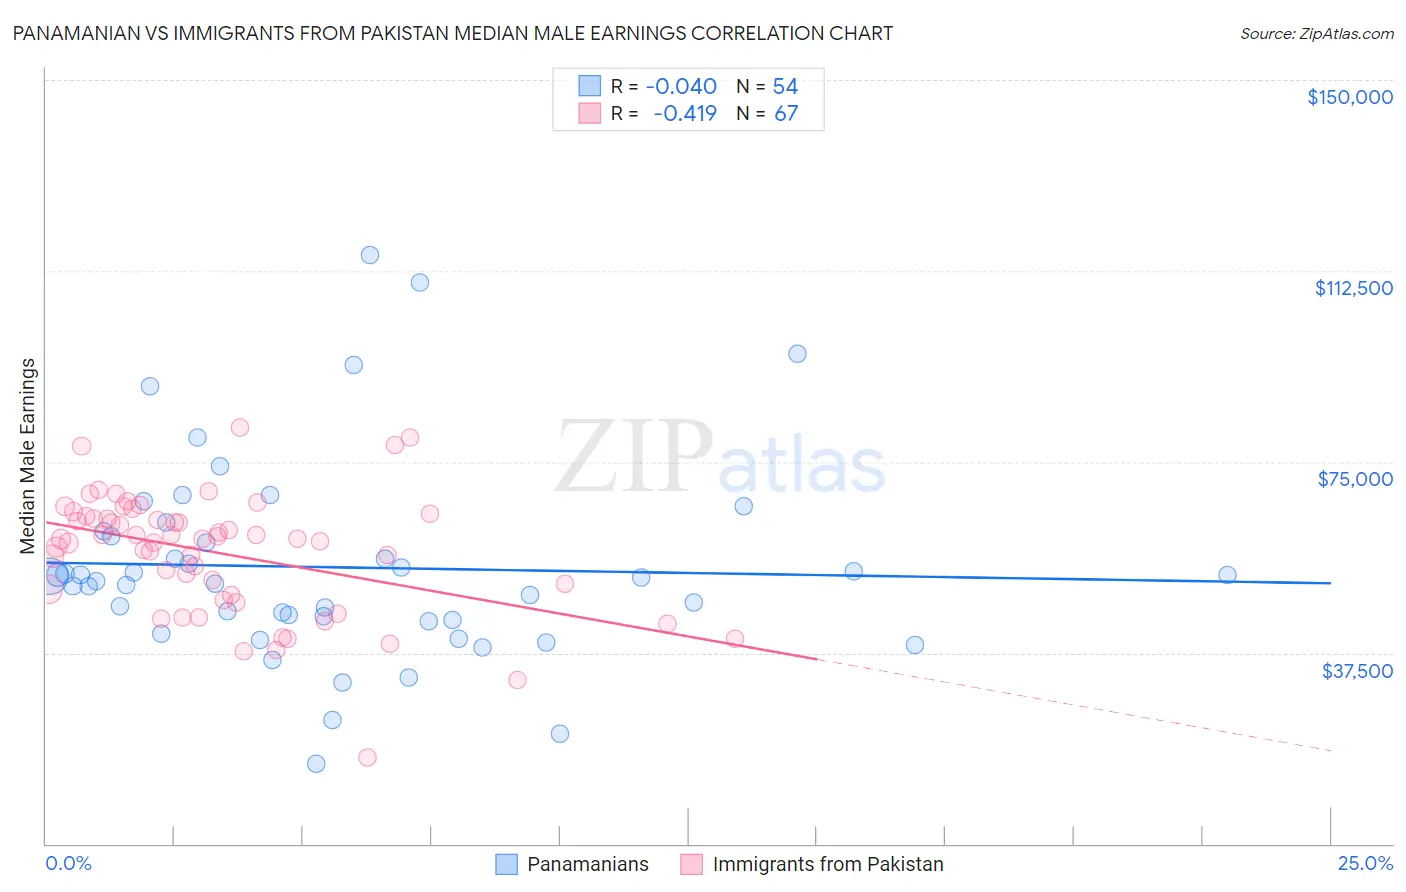
Panamanian vs Immigrants from Pakistan Median Male Earnings Correlation Chart
The statistical analysis conducted on geographies consisting of 281,209,556 people shows no correlation between the proportion of Panamanians and median male earnings in the United States with a correlation coefficient (R) of -0.040 and weighted average of $52,835. Similarly, the statistical analysis conducted on geographies consisting of 283,803,511 people shows a moderate negative correlation between the proportion of Immigrants from Pakistan and median male earnings in the United States with a correlation coefficient (R) of -0.419 and weighted average of $60,987, a difference of 15.4%.
Median Male Earnings Correlation Summary
| Measurement | Panamanian | Immigrants from Pakistan |
| Minimum | $15,735 | $17,022 |
| Maximum | $115,625 | $81,734 |
| Range | $99,890 | $64,712 |
| Mean | $54,298 | $57,165 |
| Median | $51,973 | $59,890 |
| Interquartile 25% (IQ1) | $43,917 | $48,868 |
| Interquartile 75% (IQ3) | $60,350 | $64,399 |
| Interquartile Range (IQR) | $16,433 | $15,530 |
| Standard Deviation (Sample) | $19,573 | $11,844 |
| Standard Deviation (Population) | $19,391 | $11,755 |
Similar Demographics by Median Male Earnings
Demographics Similar to Panamanians by Median Male Earnings
In terms of median male earnings, the demographic groups most similar to Panamanians are Immigrants from Uruguay ($52,860, a difference of 0.050%), Ghanaian ($52,810, a difference of 0.050%), Immigrants from Bosnia and Herzegovina ($52,869, a difference of 0.060%), Immigrants from Thailand ($52,908, a difference of 0.14%), and Immigrants from Colombia ($52,725, a difference of 0.21%).
| Demographics | Rating | Rank | Median Male Earnings |
| Immigrants | Africa | 26.6 /100 | #196 | Fair $53,457 |
| Immigrants | Kenya | 26.0 /100 | #197 | Fair $53,427 |
| Immigrants | Costa Rica | 22.6 /100 | #198 | Fair $53,237 |
| Tongans | 22.3 /100 | #199 | Fair $53,218 |
| Immigrants | Thailand | 17.5 /100 | #200 | Poor $52,908 |
| Immigrants | Bosnia and Herzegovina | 16.9 /100 | #201 | Poor $52,869 |
| Immigrants | Uruguay | 16.8 /100 | #202 | Poor $52,860 |
| Panamanians | 16.5 /100 | #203 | Poor $52,835 |
| Ghanaians | 16.1 /100 | #204 | Poor $52,810 |
| Immigrants | Colombia | 15.0 /100 | #205 | Poor $52,725 |
| Immigrants | Iraq | 14.5 /100 | #206 | Poor $52,681 |
| Vietnamese | 12.7 /100 | #207 | Poor $52,525 |
| Venezuelans | 12.5 /100 | #208 | Poor $52,510 |
| Bermudans | 12.1 /100 | #209 | Poor $52,465 |
| Delaware | 11.5 /100 | #210 | Poor $52,412 |
Demographics Similar to Immigrants from Pakistan by Median Male Earnings
In terms of median male earnings, the demographic groups most similar to Immigrants from Pakistan are Immigrants from Eastern Europe ($60,958, a difference of 0.050%), Immigrants from Indonesia ($60,935, a difference of 0.080%), Immigrants from Romania ($61,040, a difference of 0.090%), Immigrants from Croatia ($60,914, a difference of 0.12%), and Bolivian ($61,066, a difference of 0.13%).
| Demographics | Rating | Rank | Median Male Earnings |
| Lithuanians | 99.9 /100 | #56 | Exceptional $61,228 |
| Immigrants | Scotland | 99.9 /100 | #57 | Exceptional $61,220 |
| New Zealanders | 99.9 /100 | #58 | Exceptional $61,199 |
| Immigrants | Netherlands | 99.8 /100 | #59 | Exceptional $61,096 |
| Egyptians | 99.8 /100 | #60 | Exceptional $61,095 |
| Bolivians | 99.8 /100 | #61 | Exceptional $61,066 |
| Immigrants | Romania | 99.8 /100 | #62 | Exceptional $61,040 |
| Immigrants | Pakistan | 99.8 /100 | #63 | Exceptional $60,987 |
| Immigrants | Eastern Europe | 99.8 /100 | #64 | Exceptional $60,958 |
| Immigrants | Indonesia | 99.8 /100 | #65 | Exceptional $60,935 |
| Immigrants | Croatia | 99.8 /100 | #66 | Exceptional $60,914 |
| Immigrants | Spain | 99.8 /100 | #67 | Exceptional $60,750 |
| Immigrants | Serbia | 99.7 /100 | #68 | Exceptional $60,600 |
| Immigrants | Canada | 99.7 /100 | #69 | Exceptional $60,388 |
| Immigrants | Bulgaria | 99.7 /100 | #70 | Exceptional $60,358 |