Potawatomi vs Immigrants from Pakistan Disability Age 65 to 74
COMPARE
Potawatomi
Immigrants from Pakistan
Disability Age 65 to 74
Disability Age 65 to 74 Comparison
Potawatomi
Immigrants from Pakistan
27.0%
DISABILITY AGE 65 TO 74
0.0/ 100
METRIC RATING
299th/ 347
METRIC RANK
21.5%
DISABILITY AGE 65 TO 74
99.5/ 100
METRIC RATING
58th/ 347
METRIC RANK
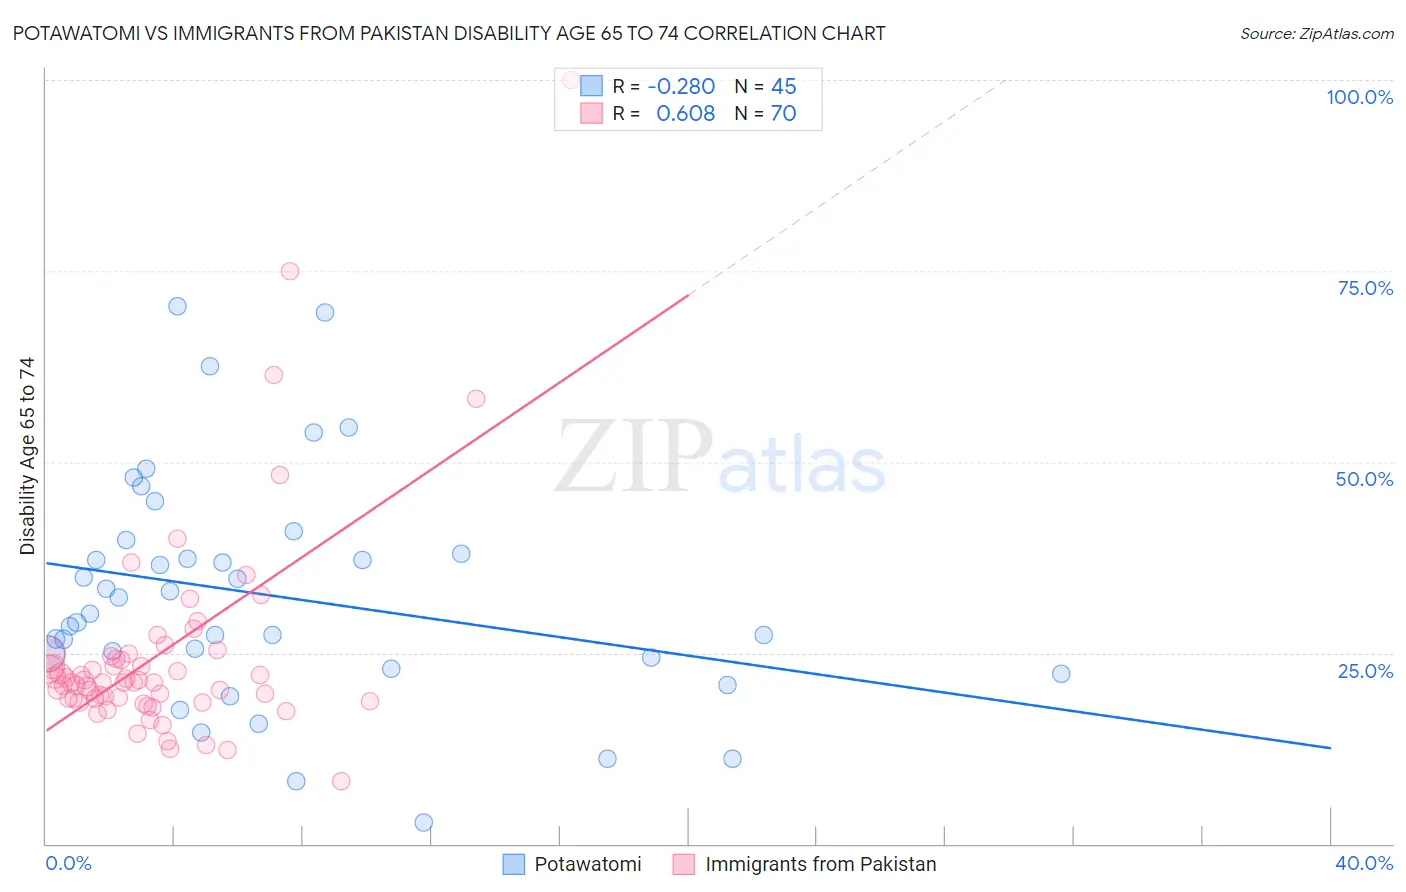
Potawatomi vs Immigrants from Pakistan Disability Age 65 to 74 Correlation Chart
The statistical analysis conducted on geographies consisting of 117,710,706 people shows a weak negative correlation between the proportion of Potawatomi and percentage of population with a disability between the ages 65 and 75 in the United States with a correlation coefficient (R) of -0.280 and weighted average of 27.0%. Similarly, the statistical analysis conducted on geographies consisting of 283,535,607 people shows a significant positive correlation between the proportion of Immigrants from Pakistan and percentage of population with a disability between the ages 65 and 75 in the United States with a correlation coefficient (R) of 0.608 and weighted average of 21.5%, a difference of 25.4%.
Disability Age 65 to 74 Correlation Summary
| Measurement | Potawatomi | Immigrants from Pakistan |
| Minimum | 2.7% | 8.2% |
| Maximum | 70.4% | 100.0% |
| Range | 67.7% | 91.8% |
| Mean | 32.5% | 24.9% |
| Median | 30.1% | 21.1% |
| Interquartile 25% (IQ1) | 23.6% | 19.0% |
| Interquartile 75% (IQ3) | 38.9% | 24.6% |
| Interquartile Range (IQR) | 15.2% | 5.7% |
| Standard Deviation (Sample) | 15.0% | 14.2% |
| Standard Deviation (Population) | 14.9% | 14.1% |
Similar Demographics by Disability Age 65 to 74
Demographics Similar to Potawatomi by Disability Age 65 to 74
In terms of disability age 65 to 74, the demographic groups most similar to Potawatomi are Immigrants from Yemen (27.0%, a difference of 0.030%), Immigrants from Dominican Republic (27.0%, a difference of 0.030%), Fijian (27.0%, a difference of 0.050%), Immigrants from Mexico (27.1%, a difference of 0.35%), and Central American Indian (27.1%, a difference of 0.36%).
| Demographics | Rating | Rank | Disability Age 65 to 74 |
| Blackfeet | 0.0 /100 | #292 | Tragic 26.6% |
| Immigrants | Central America | 0.0 /100 | #293 | Tragic 26.6% |
| Dominicans | 0.0 /100 | #294 | Tragic 26.7% |
| Hispanics or Latinos | 0.0 /100 | #295 | Tragic 26.7% |
| Bangladeshis | 0.0 /100 | #296 | Tragic 26.8% |
| Fijians | 0.0 /100 | #297 | Tragic 27.0% |
| Immigrants | Yemen | 0.0 /100 | #298 | Tragic 27.0% |
| Potawatomi | 0.0 /100 | #299 | Tragic 27.0% |
| Immigrants | Dominican Republic | 0.0 /100 | #300 | Tragic 27.0% |
| Immigrants | Mexico | 0.0 /100 | #301 | Tragic 27.1% |
| Central American Indians | 0.0 /100 | #302 | Tragic 27.1% |
| Tlingit-Haida | 0.0 /100 | #303 | Tragic 27.1% |
| Puget Sound Salish | 0.0 /100 | #304 | Tragic 27.2% |
| Mexicans | 0.0 /100 | #305 | Tragic 27.2% |
| Blacks/African Americans | 0.0 /100 | #306 | Tragic 27.3% |
Demographics Similar to Immigrants from Pakistan by Disability Age 65 to 74
In terms of disability age 65 to 74, the demographic groups most similar to Immigrants from Pakistan are Immigrants from Asia (21.5%, a difference of 0.030%), Zimbabwean (21.5%, a difference of 0.030%), Immigrants from North Macedonia (21.6%, a difference of 0.060%), Egyptian (21.6%, a difference of 0.090%), and Carpatho Rusyn (21.6%, a difference of 0.11%).
| Demographics | Rating | Rank | Disability Age 65 to 74 |
| Immigrants | Serbia | 99.6 /100 | #51 | Exceptional 21.4% |
| Immigrants | France | 99.6 /100 | #52 | Exceptional 21.5% |
| Bhutanese | 99.6 /100 | #53 | Exceptional 21.5% |
| Immigrants | Italy | 99.6 /100 | #54 | Exceptional 21.5% |
| Immigrants | Romania | 99.5 /100 | #55 | Exceptional 21.5% |
| Immigrants | Denmark | 99.5 /100 | #56 | Exceptional 21.5% |
| Immigrants | Asia | 99.5 /100 | #57 | Exceptional 21.5% |
| Immigrants | Pakistan | 99.5 /100 | #58 | Exceptional 21.5% |
| Zimbabweans | 99.5 /100 | #59 | Exceptional 21.5% |
| Immigrants | North Macedonia | 99.5 /100 | #60 | Exceptional 21.6% |
| Egyptians | 99.5 /100 | #61 | Exceptional 21.6% |
| Carpatho Rusyns | 99.5 /100 | #62 | Exceptional 21.6% |
| Immigrants | Europe | 99.4 /100 | #63 | Exceptional 21.6% |
| Immigrants | Latvia | 99.4 /100 | #64 | Exceptional 21.6% |
| Immigrants | Russia | 99.4 /100 | #65 | Exceptional 21.6% |