Bangladeshi vs Immigrants from Pakistan Median Male Earnings
COMPARE
Bangladeshi
Immigrants from Pakistan
Median Male Earnings
Median Male Earnings Comparison
Bangladeshis
Immigrants from Pakistan
$46,744
MEDIAN MALE EARNINGS
0.1/ 100
METRIC RATING
304th/ 347
METRIC RANK
$60,987
MEDIAN MALE EARNINGS
99.8/ 100
METRIC RATING
63rd/ 347
METRIC RANK
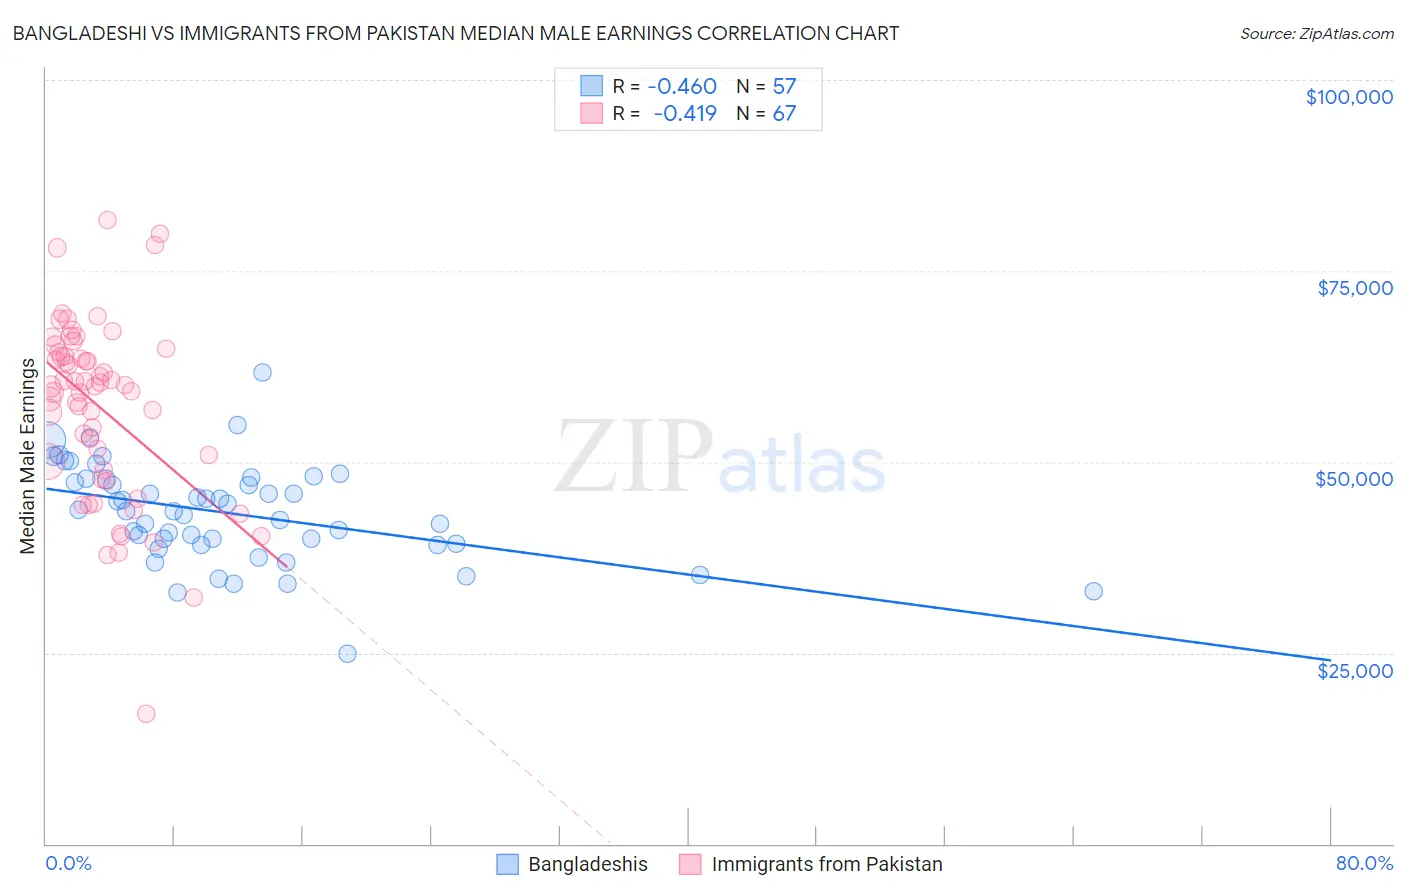
Bangladeshi vs Immigrants from Pakistan Median Male Earnings Correlation Chart
The statistical analysis conducted on geographies consisting of 141,442,222 people shows a moderate negative correlation between the proportion of Bangladeshis and median male earnings in the United States with a correlation coefficient (R) of -0.460 and weighted average of $46,744. Similarly, the statistical analysis conducted on geographies consisting of 283,803,511 people shows a moderate negative correlation between the proportion of Immigrants from Pakistan and median male earnings in the United States with a correlation coefficient (R) of -0.419 and weighted average of $60,987, a difference of 30.5%.
Median Male Earnings Correlation Summary
| Measurement | Bangladeshi | Immigrants from Pakistan |
| Minimum | $24,888 | $17,022 |
| Maximum | $61,776 | $81,734 |
| Range | $36,888 | $64,712 |
| Mean | $43,307 | $57,165 |
| Median | $43,611 | $59,890 |
| Interquartile 25% (IQ1) | $39,220 | $48,868 |
| Interquartile 75% (IQ3) | $47,786 | $64,399 |
| Interquartile Range (IQR) | $8,565 | $15,530 |
| Standard Deviation (Sample) | $6,481 | $11,844 |
| Standard Deviation (Population) | $6,424 | $11,755 |
Similar Demographics by Median Male Earnings
Demographics Similar to Bangladeshis by Median Male Earnings
In terms of median male earnings, the demographic groups most similar to Bangladeshis are Guatemalan ($46,736, a difference of 0.020%), Yaqui ($46,777, a difference of 0.070%), Seminole ($46,783, a difference of 0.080%), Dutch West Indian ($46,656, a difference of 0.19%), and Immigrants from Dominican Republic ($46,655, a difference of 0.19%).
| Demographics | Rating | Rank | Median Male Earnings |
| Dominicans | 0.1 /100 | #297 | Tragic $47,204 |
| Immigrants | Micronesia | 0.1 /100 | #298 | Tragic $47,177 |
| Immigrants | Zaire | 0.1 /100 | #299 | Tragic $47,070 |
| U.S. Virgin Islanders | 0.1 /100 | #300 | Tragic $47,066 |
| Immigrants | Latin America | 0.1 /100 | #301 | Tragic $46,941 |
| Seminole | 0.1 /100 | #302 | Tragic $46,783 |
| Yaqui | 0.1 /100 | #303 | Tragic $46,777 |
| Bangladeshis | 0.1 /100 | #304 | Tragic $46,744 |
| Guatemalans | 0.0 /100 | #305 | Tragic $46,736 |
| Dutch West Indians | 0.0 /100 | #306 | Tragic $46,656 |
| Immigrants | Dominican Republic | 0.0 /100 | #307 | Tragic $46,655 |
| Ottawa | 0.0 /100 | #308 | Tragic $46,611 |
| Creek | 0.0 /100 | #309 | Tragic $46,594 |
| Cubans | 0.0 /100 | #310 | Tragic $46,580 |
| Apache | 0.0 /100 | #311 | Tragic $46,429 |
Demographics Similar to Immigrants from Pakistan by Median Male Earnings
In terms of median male earnings, the demographic groups most similar to Immigrants from Pakistan are Immigrants from Eastern Europe ($60,958, a difference of 0.050%), Immigrants from Indonesia ($60,935, a difference of 0.080%), Immigrants from Romania ($61,040, a difference of 0.090%), Immigrants from Croatia ($60,914, a difference of 0.12%), and Bolivian ($61,066, a difference of 0.13%).
| Demographics | Rating | Rank | Median Male Earnings |
| Lithuanians | 99.9 /100 | #56 | Exceptional $61,228 |
| Immigrants | Scotland | 99.9 /100 | #57 | Exceptional $61,220 |
| New Zealanders | 99.9 /100 | #58 | Exceptional $61,199 |
| Immigrants | Netherlands | 99.8 /100 | #59 | Exceptional $61,096 |
| Egyptians | 99.8 /100 | #60 | Exceptional $61,095 |
| Bolivians | 99.8 /100 | #61 | Exceptional $61,066 |
| Immigrants | Romania | 99.8 /100 | #62 | Exceptional $61,040 |
| Immigrants | Pakistan | 99.8 /100 | #63 | Exceptional $60,987 |
| Immigrants | Eastern Europe | 99.8 /100 | #64 | Exceptional $60,958 |
| Immigrants | Indonesia | 99.8 /100 | #65 | Exceptional $60,935 |
| Immigrants | Croatia | 99.8 /100 | #66 | Exceptional $60,914 |
| Immigrants | Spain | 99.8 /100 | #67 | Exceptional $60,750 |
| Immigrants | Serbia | 99.7 /100 | #68 | Exceptional $60,600 |
| Immigrants | Canada | 99.7 /100 | #69 | Exceptional $60,388 |
| Immigrants | Bulgaria | 99.7 /100 | #70 | Exceptional $60,358 |