Potawatomi vs Costa Rican Median Male Earnings
COMPARE
Potawatomi
Costa Rican
Median Male Earnings
Median Male Earnings Comparison
Potawatomi
Costa Ricans
$48,768
MEDIAN MALE EARNINGS
0.4/ 100
METRIC RATING
270th/ 347
METRIC RANK
$54,279
MEDIAN MALE EARNINGS
44.8/ 100
METRIC RATING
177th/ 347
METRIC RANK
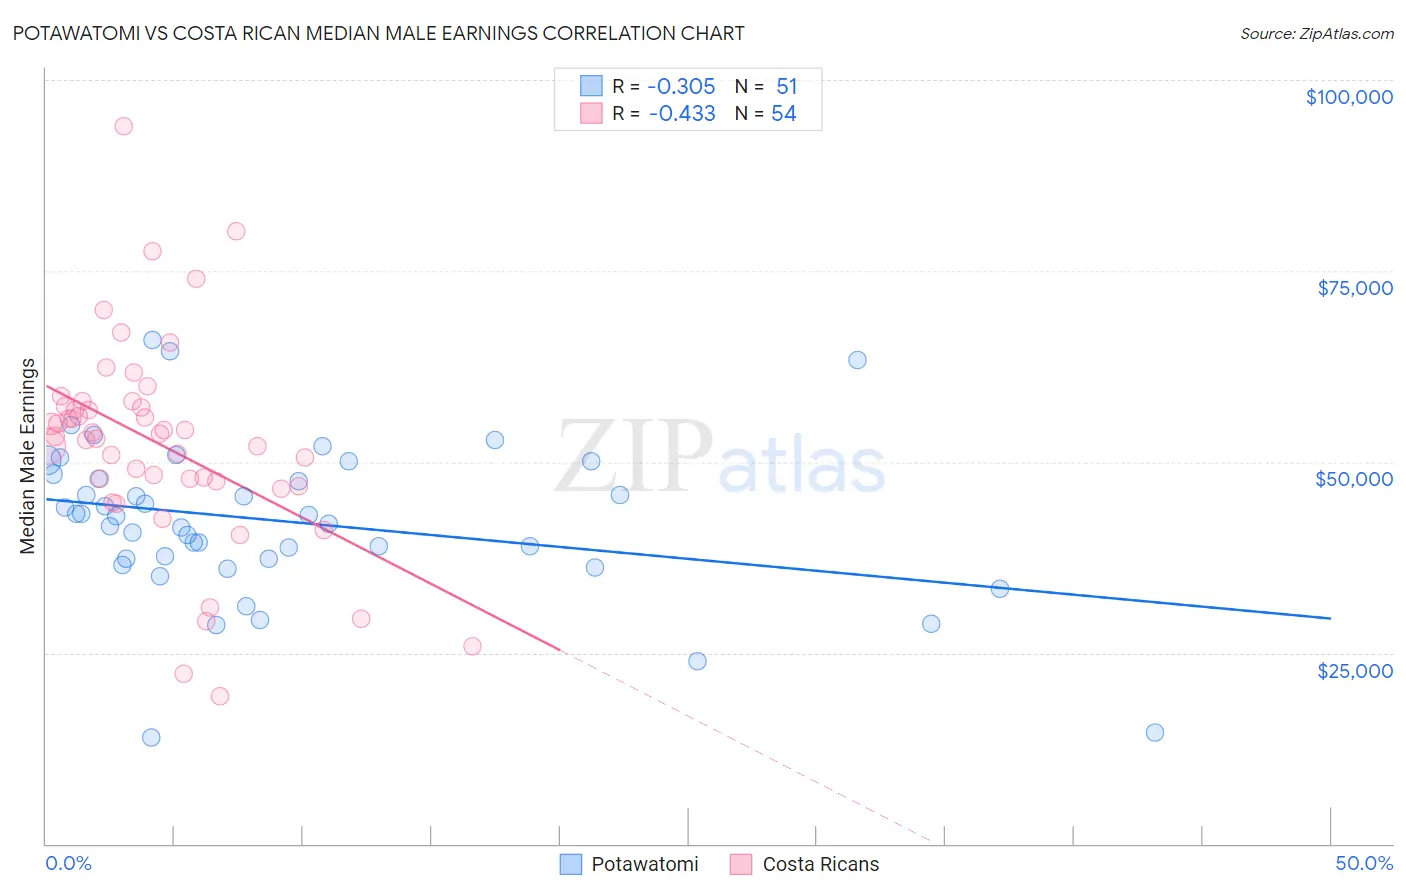
Potawatomi vs Costa Rican Median Male Earnings Correlation Chart
The statistical analysis conducted on geographies consisting of 117,758,062 people shows a mild negative correlation between the proportion of Potawatomi and median male earnings in the United States with a correlation coefficient (R) of -0.305 and weighted average of $48,768. Similarly, the statistical analysis conducted on geographies consisting of 253,565,867 people shows a moderate negative correlation between the proportion of Costa Ricans and median male earnings in the United States with a correlation coefficient (R) of -0.433 and weighted average of $54,279, a difference of 11.3%.
Median Male Earnings Correlation Summary
| Measurement | Potawatomi | Costa Rican |
| Minimum | $13,889 | $19,389 |
| Maximum | $66,032 | $93,946 |
| Range | $52,143 | $74,557 |
| Mean | $42,177 | $52,427 |
| Median | $42,915 | $53,504 |
| Interquartile 25% (IQ1) | $37,274 | $47,415 |
| Interquartile 75% (IQ3) | $48,416 | $57,229 |
| Interquartile Range (IQR) | $11,141 | $9,814 |
| Standard Deviation (Sample) | $10,408 | $13,517 |
| Standard Deviation (Population) | $10,305 | $13,391 |
Similar Demographics by Median Male Earnings
Demographics Similar to Potawatomi by Median Male Earnings
In terms of median male earnings, the demographic groups most similar to Potawatomi are Tsimshian ($48,836, a difference of 0.14%), Cherokee ($48,669, a difference of 0.20%), Salvadoran ($48,646, a difference of 0.25%), Ute ($48,899, a difference of 0.27%), and Jamaican ($48,632, a difference of 0.28%).
| Demographics | Rating | Rank | Median Male Earnings |
| Nicaraguans | 0.6 /100 | #263 | Tragic $49,215 |
| Immigrants | Middle Africa | 0.6 /100 | #264 | Tragic $49,201 |
| Immigrants | Laos | 0.6 /100 | #265 | Tragic $49,190 |
| Somalis | 0.5 /100 | #266 | Tragic $49,025 |
| Spanish Americans | 0.5 /100 | #267 | Tragic $49,008 |
| Ute | 0.4 /100 | #268 | Tragic $48,899 |
| Tsimshian | 0.4 /100 | #269 | Tragic $48,836 |
| Potawatomi | 0.4 /100 | #270 | Tragic $48,768 |
| Cherokee | 0.3 /100 | #271 | Tragic $48,669 |
| Salvadorans | 0.3 /100 | #272 | Tragic $48,646 |
| Jamaicans | 0.3 /100 | #273 | Tragic $48,632 |
| Colville | 0.3 /100 | #274 | Tragic $48,516 |
| Immigrants | Somalia | 0.3 /100 | #275 | Tragic $48,439 |
| Blackfeet | 0.3 /100 | #276 | Tragic $48,402 |
| Belizeans | 0.2 /100 | #277 | Tragic $48,358 |
Demographics Similar to Costa Ricans by Median Male Earnings
In terms of median male earnings, the demographic groups most similar to Costa Ricans are Sierra Leonean ($54,279, a difference of 0.0%), Celtic ($54,242, a difference of 0.070%), Iraqi ($54,182, a difference of 0.18%), Immigrants ($54,168, a difference of 0.21%), and Spaniard ($54,401, a difference of 0.22%).
| Demographics | Rating | Rank | Median Male Earnings |
| Finns | 55.6 /100 | #170 | Average $54,721 |
| Immigrants | Peru | 54.9 /100 | #171 | Average $54,695 |
| Welsh | 53.8 /100 | #172 | Average $54,647 |
| South American Indians | 50.4 /100 | #173 | Average $54,508 |
| South Americans | 50.0 /100 | #174 | Average $54,492 |
| Dutch | 48.0 /100 | #175 | Average $54,410 |
| Spaniards | 47.8 /100 | #176 | Average $54,401 |
| Costa Ricans | 44.8 /100 | #177 | Average $54,279 |
| Sierra Leoneans | 44.8 /100 | #178 | Average $54,279 |
| Celtics | 43.9 /100 | #179 | Average $54,242 |
| Iraqis | 42.5 /100 | #180 | Average $54,182 |
| Immigrants | Immigrants | 42.1 /100 | #181 | Average $54,168 |
| Yugoslavians | 37.4 /100 | #182 | Fair $53,967 |
| Immigrants | South America | 37.3 /100 | #183 | Fair $53,962 |
| Whites/Caucasians | 36.5 /100 | #184 | Fair $53,925 |