Polish vs Fijian Median Earnings
COMPARE
Polish
Fijian
Median Earnings
Median Earnings Comparison
Poles
Fijians
$48,659
MEDIAN EARNINGS
95.8/ 100
METRIC RATING
119th/ 347
METRIC RANK
$40,193
MEDIAN EARNINGS
0.0/ 100
METRIC RATING
317th/ 347
METRIC RANK
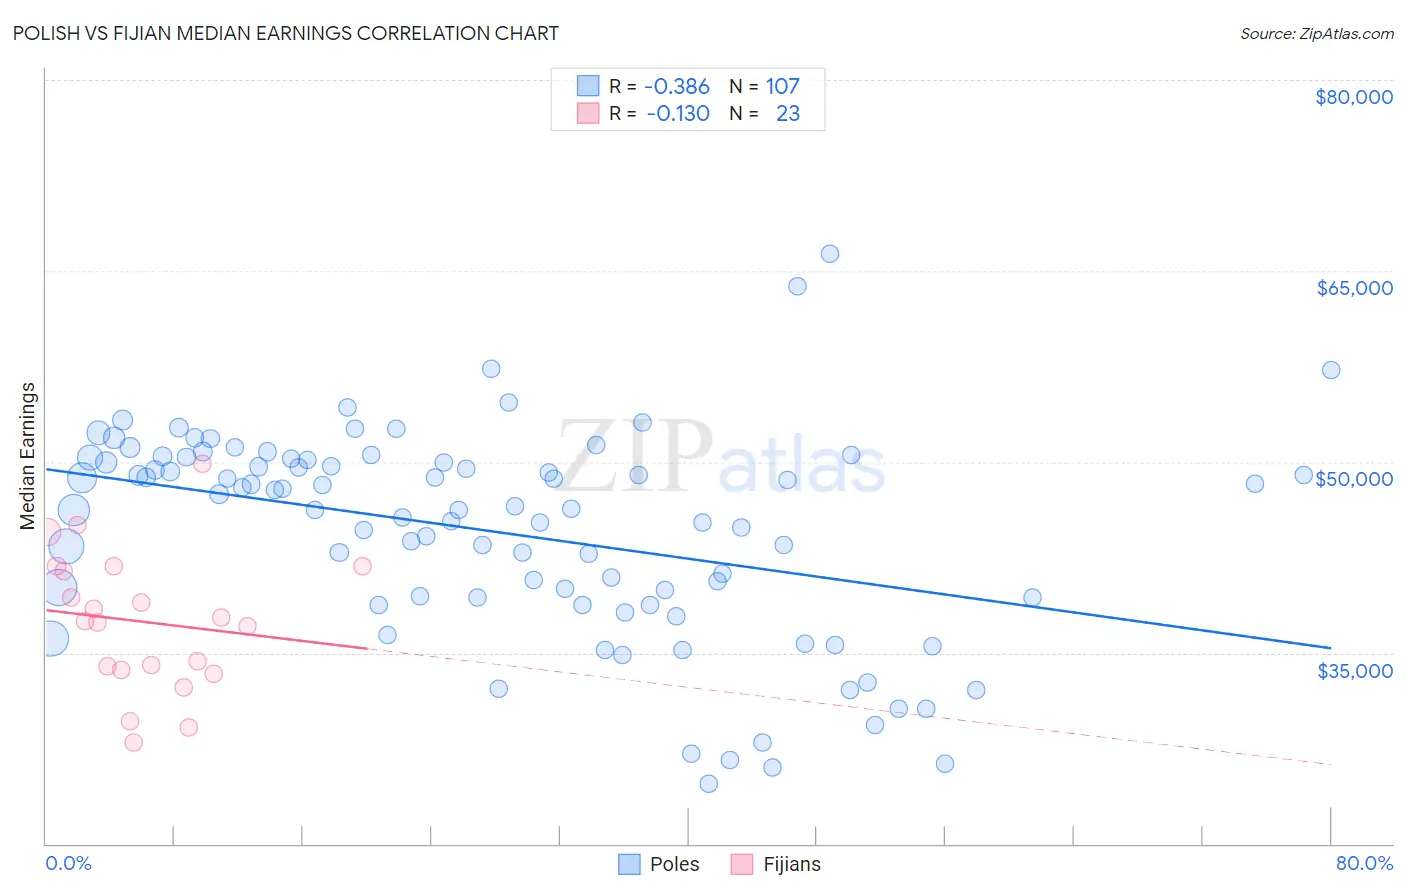
Polish vs Fijian Median Earnings Correlation Chart
The statistical analysis conducted on geographies consisting of 560,312,185 people shows a mild negative correlation between the proportion of Poles and median earnings in the United States with a correlation coefficient (R) of -0.386 and weighted average of $48,659. Similarly, the statistical analysis conducted on geographies consisting of 55,947,867 people shows a poor negative correlation between the proportion of Fijians and median earnings in the United States with a correlation coefficient (R) of -0.130 and weighted average of $40,193, a difference of 21.1%.
Median Earnings Correlation Summary
| Measurement | Polish | Fijian |
| Minimum | $24,750 | $27,917 |
| Maximum | $66,354 | $49,875 |
| Range | $41,604 | $21,958 |
| Mean | $44,491 | $37,430 |
| Median | $46,283 | $37,445 |
| Interquartile 25% (IQ1) | $39,299 | $33,695 |
| Interquartile 75% (IQ3) | $50,191 | $41,805 |
| Interquartile Range (IQR) | $10,892 | $8,109 |
| Standard Deviation (Sample) | $8,192 | $5,451 |
| Standard Deviation (Population) | $8,153 | $5,331 |
Similar Demographics by Median Earnings
Demographics Similar to Poles by Median Earnings
In terms of median earnings, the demographic groups most similar to Poles are Immigrants from Jordan ($48,673, a difference of 0.030%), Serbian ($48,677, a difference of 0.040%), Carpatho Rusyn ($48,617, a difference of 0.080%), Arab ($48,599, a difference of 0.12%), and Korean ($48,727, a difference of 0.14%).
| Demographics | Rating | Rank | Median Earnings |
| Northern Europeans | 96.9 /100 | #112 | Exceptional $48,887 |
| Immigrants | Kuwait | 96.8 /100 | #113 | Exceptional $48,861 |
| Moroccans | 96.7 /100 | #114 | Exceptional $48,838 |
| Chinese | 96.7 /100 | #115 | Exceptional $48,836 |
| Koreans | 96.2 /100 | #116 | Exceptional $48,727 |
| Serbians | 95.9 /100 | #117 | Exceptional $48,677 |
| Immigrants | Jordan | 95.9 /100 | #118 | Exceptional $48,673 |
| Poles | 95.8 /100 | #119 | Exceptional $48,659 |
| Carpatho Rusyns | 95.5 /100 | #120 | Exceptional $48,617 |
| Arabs | 95.4 /100 | #121 | Exceptional $48,599 |
| Chileans | 94.8 /100 | #122 | Exceptional $48,504 |
| Immigrants | Syria | 93.9 /100 | #123 | Exceptional $48,375 |
| Brazilians | 93.7 /100 | #124 | Exceptional $48,356 |
| Immigrants | Fiji | 93.3 /100 | #125 | Exceptional $48,305 |
| Assyrians/Chaldeans/Syriacs | 93.3 /100 | #126 | Exceptional $48,304 |
Demographics Similar to Fijians by Median Earnings
In terms of median earnings, the demographic groups most similar to Fijians are Immigrants from Honduras ($40,195, a difference of 0.0%), Cheyenne ($40,233, a difference of 0.10%), Seminole ($40,233, a difference of 0.10%), Choctaw ($40,270, a difference of 0.19%), and Dutch West Indian ($40,107, a difference of 0.21%).
| Demographics | Rating | Rank | Median Earnings |
| Apache | 0.0 /100 | #310 | Tragic $40,388 |
| Hispanics or Latinos | 0.0 /100 | #311 | Tragic $40,288 |
| Chippewa | 0.0 /100 | #312 | Tragic $40,287 |
| Choctaw | 0.0 /100 | #313 | Tragic $40,270 |
| Cheyenne | 0.0 /100 | #314 | Tragic $40,233 |
| Seminole | 0.0 /100 | #315 | Tragic $40,233 |
| Immigrants | Honduras | 0.0 /100 | #316 | Tragic $40,195 |
| Fijians | 0.0 /100 | #317 | Tragic $40,193 |
| Dutch West Indians | 0.0 /100 | #318 | Tragic $40,107 |
| Blacks/African Americans | 0.0 /100 | #319 | Tragic $40,085 |
| Immigrants | Bahamas | 0.0 /100 | #320 | Tragic $39,861 |
| Mexicans | 0.0 /100 | #321 | Tragic $39,834 |
| Immigrants | Central America | 0.0 /100 | #322 | Tragic $39,762 |
| Bahamians | 0.0 /100 | #323 | Tragic $39,735 |
| Ottawa | 0.0 /100 | #324 | Tragic $39,721 |