Polish vs Indonesian Median Earnings
COMPARE
Polish
Indonesian
Median Earnings
Median Earnings Comparison
Poles
Indonesians
$48,659
MEDIAN EARNINGS
95.8/ 100
METRIC RATING
119th/ 347
METRIC RANK
$41,701
MEDIAN EARNINGS
0.1/ 100
METRIC RATING
287th/ 347
METRIC RANK
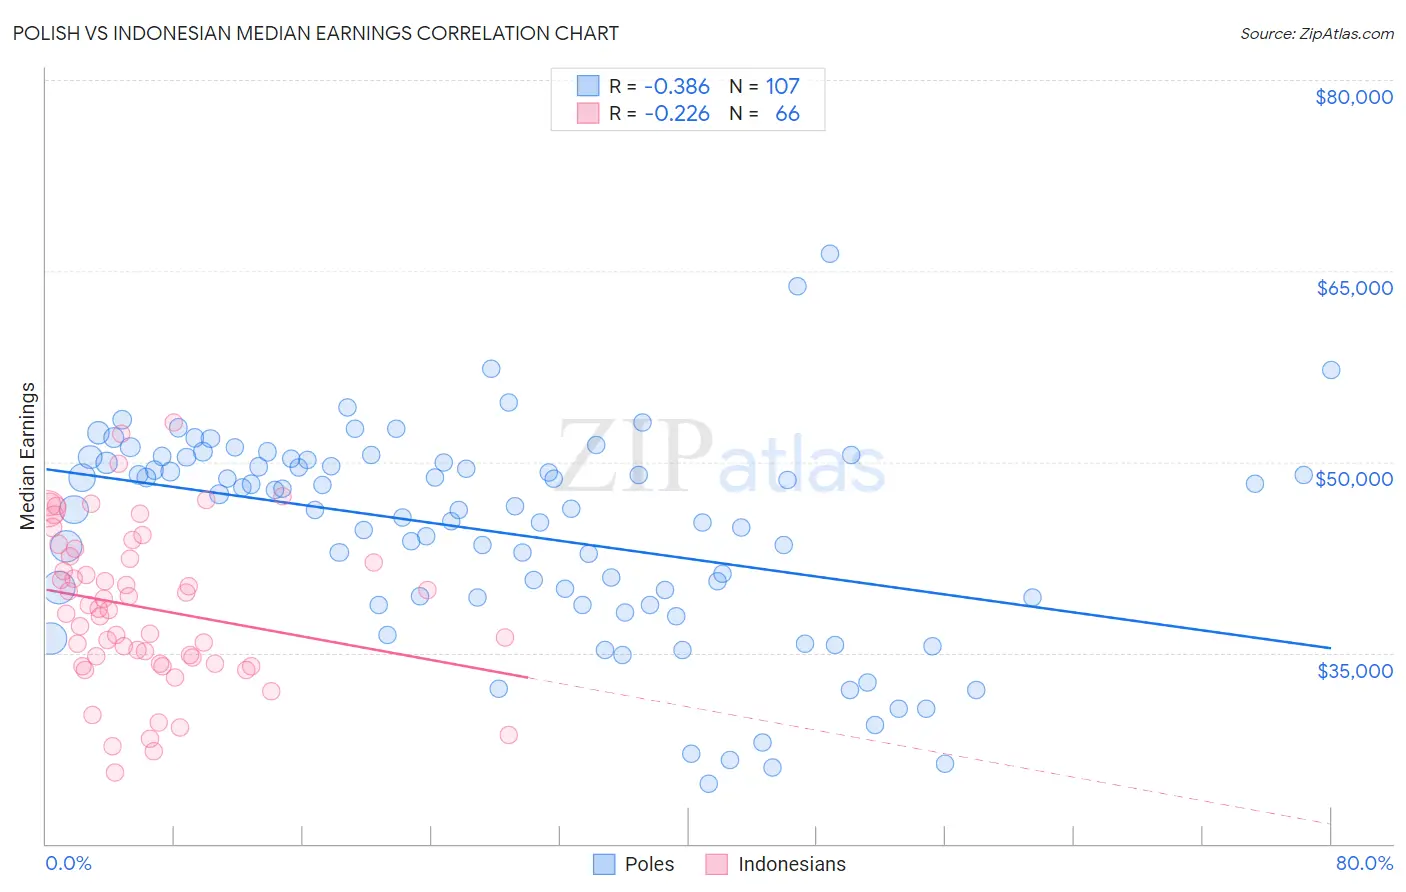
Polish vs Indonesian Median Earnings Correlation Chart
The statistical analysis conducted on geographies consisting of 560,312,185 people shows a mild negative correlation between the proportion of Poles and median earnings in the United States with a correlation coefficient (R) of -0.386 and weighted average of $48,659. Similarly, the statistical analysis conducted on geographies consisting of 162,738,870 people shows a weak negative correlation between the proportion of Indonesians and median earnings in the United States with a correlation coefficient (R) of -0.226 and weighted average of $41,701, a difference of 16.7%.
Median Earnings Correlation Summary
| Measurement | Polish | Indonesian |
| Minimum | $24,750 | $25,580 |
| Maximum | $66,354 | $53,125 |
| Range | $41,604 | $27,545 |
| Mean | $44,491 | $38,511 |
| Median | $46,283 | $38,377 |
| Interquartile 25% (IQ1) | $39,299 | $34,157 |
| Interquartile 75% (IQ3) | $50,191 | $42,572 |
| Interquartile Range (IQR) | $10,892 | $8,415 |
| Standard Deviation (Sample) | $8,192 | $6,165 |
| Standard Deviation (Population) | $8,153 | $6,119 |
Similar Demographics by Median Earnings
Demographics Similar to Poles by Median Earnings
In terms of median earnings, the demographic groups most similar to Poles are Immigrants from Jordan ($48,673, a difference of 0.030%), Serbian ($48,677, a difference of 0.040%), Carpatho Rusyn ($48,617, a difference of 0.080%), Arab ($48,599, a difference of 0.12%), and Korean ($48,727, a difference of 0.14%).
| Demographics | Rating | Rank | Median Earnings |
| Northern Europeans | 96.9 /100 | #112 | Exceptional $48,887 |
| Immigrants | Kuwait | 96.8 /100 | #113 | Exceptional $48,861 |
| Moroccans | 96.7 /100 | #114 | Exceptional $48,838 |
| Chinese | 96.7 /100 | #115 | Exceptional $48,836 |
| Koreans | 96.2 /100 | #116 | Exceptional $48,727 |
| Serbians | 95.9 /100 | #117 | Exceptional $48,677 |
| Immigrants | Jordan | 95.9 /100 | #118 | Exceptional $48,673 |
| Poles | 95.8 /100 | #119 | Exceptional $48,659 |
| Carpatho Rusyns | 95.5 /100 | #120 | Exceptional $48,617 |
| Arabs | 95.4 /100 | #121 | Exceptional $48,599 |
| Chileans | 94.8 /100 | #122 | Exceptional $48,504 |
| Immigrants | Syria | 93.9 /100 | #123 | Exceptional $48,375 |
| Brazilians | 93.7 /100 | #124 | Exceptional $48,356 |
| Immigrants | Fiji | 93.3 /100 | #125 | Exceptional $48,305 |
| Assyrians/Chaldeans/Syriacs | 93.3 /100 | #126 | Exceptional $48,304 |
Demographics Similar to Indonesians by Median Earnings
In terms of median earnings, the demographic groups most similar to Indonesians are Mexican American Indian ($41,719, a difference of 0.040%), Immigrants from Nicaragua ($41,737, a difference of 0.090%), Blackfeet ($41,822, a difference of 0.29%), Immigrants from Dominican Republic ($41,554, a difference of 0.35%), and Dominican ($41,864, a difference of 0.39%).
| Demographics | Rating | Rank | Median Earnings |
| Hmong | 0.2 /100 | #280 | Tragic $42,111 |
| Marshallese | 0.2 /100 | #281 | Tragic $41,969 |
| Africans | 0.2 /100 | #282 | Tragic $41,955 |
| Dominicans | 0.2 /100 | #283 | Tragic $41,864 |
| Blackfeet | 0.2 /100 | #284 | Tragic $41,822 |
| Immigrants | Nicaragua | 0.1 /100 | #285 | Tragic $41,737 |
| Mexican American Indians | 0.1 /100 | #286 | Tragic $41,719 |
| Indonesians | 0.1 /100 | #287 | Tragic $41,701 |
| Immigrants | Dominican Republic | 0.1 /100 | #288 | Tragic $41,554 |
| Comanche | 0.1 /100 | #289 | Tragic $41,519 |
| Paiute | 0.1 /100 | #290 | Tragic $41,508 |
| Central American Indians | 0.1 /100 | #291 | Tragic $41,474 |
| U.S. Virgin Islanders | 0.1 /100 | #292 | Tragic $41,448 |
| Immigrants | Zaire | 0.1 /100 | #293 | Tragic $41,325 |
| Potawatomi | 0.1 /100 | #294 | Tragic $41,288 |