Polish vs Thai Median Earnings
COMPARE
Polish
Thai
Median Earnings
Median Earnings Comparison
Poles
Thais
$48,659
MEDIAN EARNINGS
95.8/ 100
METRIC RATING
119th/ 347
METRIC RANK
$59,237
MEDIAN EARNINGS
100.0/ 100
METRIC RATING
5th/ 347
METRIC RANK
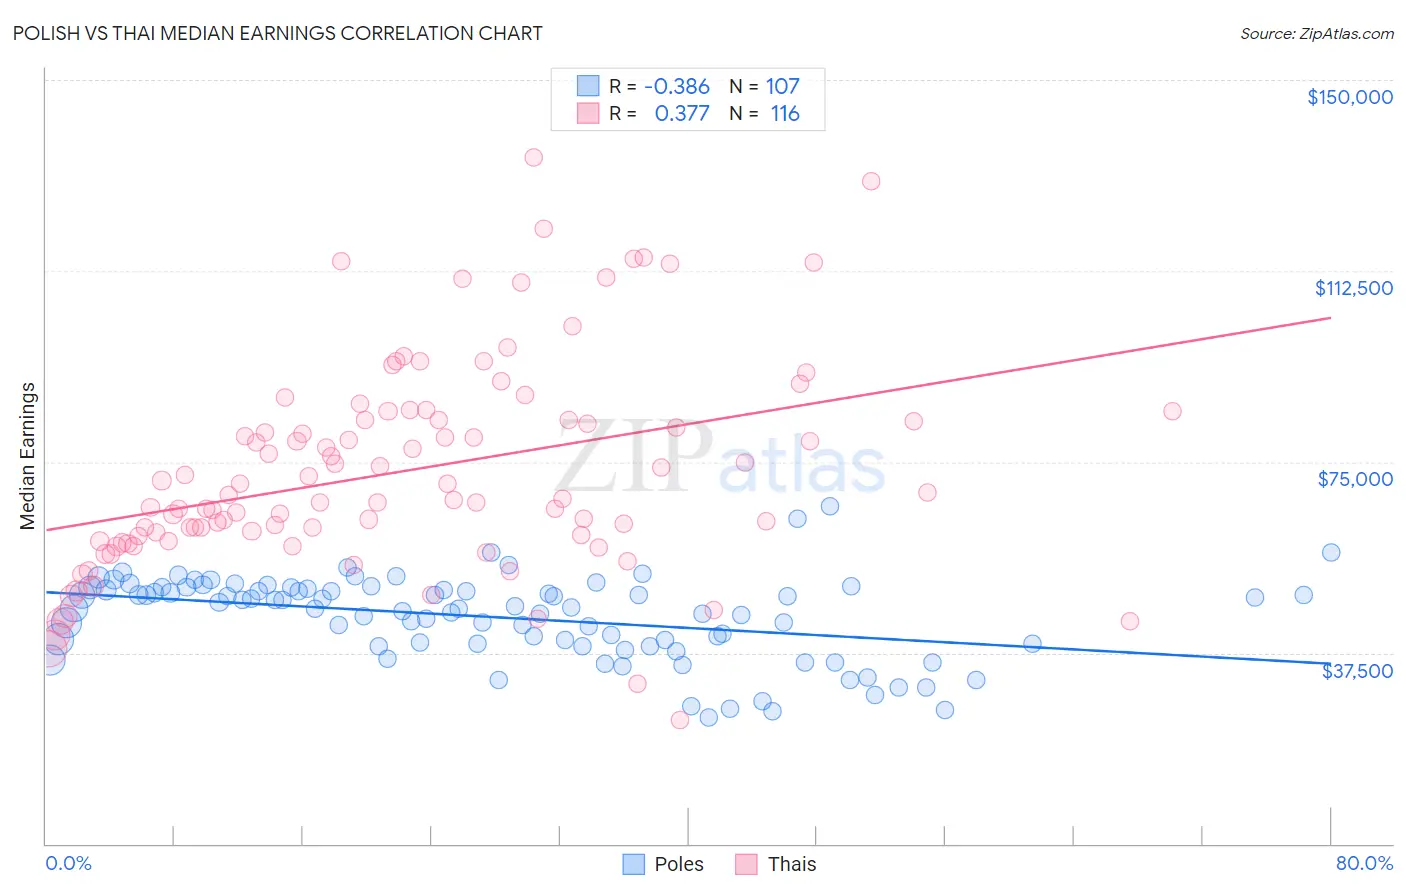
Polish vs Thai Median Earnings Correlation Chart
The statistical analysis conducted on geographies consisting of 560,312,185 people shows a mild negative correlation between the proportion of Poles and median earnings in the United States with a correlation coefficient (R) of -0.386 and weighted average of $48,659. Similarly, the statistical analysis conducted on geographies consisting of 475,851,474 people shows a mild positive correlation between the proportion of Thais and median earnings in the United States with a correlation coefficient (R) of 0.377 and weighted average of $59,237, a difference of 21.7%.
Median Earnings Correlation Summary
| Measurement | Polish | Thai |
| Minimum | $24,750 | $24,353 |
| Maximum | $66,354 | $134,793 |
| Range | $41,604 | $110,440 |
| Mean | $44,491 | $73,089 |
| Median | $46,283 | $68,147 |
| Interquartile 25% (IQ1) | $39,299 | $59,963 |
| Interquartile 75% (IQ3) | $50,191 | $83,196 |
| Interquartile Range (IQR) | $10,892 | $23,232 |
| Standard Deviation (Sample) | $8,192 | $20,568 |
| Standard Deviation (Population) | $8,153 | $20,479 |
Similar Demographics by Median Earnings
Demographics Similar to Poles by Median Earnings
In terms of median earnings, the demographic groups most similar to Poles are Immigrants from Jordan ($48,673, a difference of 0.030%), Serbian ($48,677, a difference of 0.040%), Carpatho Rusyn ($48,617, a difference of 0.080%), Arab ($48,599, a difference of 0.12%), and Korean ($48,727, a difference of 0.14%).
| Demographics | Rating | Rank | Median Earnings |
| Northern Europeans | 96.9 /100 | #112 | Exceptional $48,887 |
| Immigrants | Kuwait | 96.8 /100 | #113 | Exceptional $48,861 |
| Moroccans | 96.7 /100 | #114 | Exceptional $48,838 |
| Chinese | 96.7 /100 | #115 | Exceptional $48,836 |
| Koreans | 96.2 /100 | #116 | Exceptional $48,727 |
| Serbians | 95.9 /100 | #117 | Exceptional $48,677 |
| Immigrants | Jordan | 95.9 /100 | #118 | Exceptional $48,673 |
| Poles | 95.8 /100 | #119 | Exceptional $48,659 |
| Carpatho Rusyns | 95.5 /100 | #120 | Exceptional $48,617 |
| Arabs | 95.4 /100 | #121 | Exceptional $48,599 |
| Chileans | 94.8 /100 | #122 | Exceptional $48,504 |
| Immigrants | Syria | 93.9 /100 | #123 | Exceptional $48,375 |
| Brazilians | 93.7 /100 | #124 | Exceptional $48,356 |
| Immigrants | Fiji | 93.3 /100 | #125 | Exceptional $48,305 |
| Assyrians/Chaldeans/Syriacs | 93.3 /100 | #126 | Exceptional $48,304 |
Demographics Similar to Thais by Median Earnings
In terms of median earnings, the demographic groups most similar to Thais are Immigrants from Hong Kong ($59,433, a difference of 0.33%), Immigrants from Singapore ($59,038, a difference of 0.34%), Iranian ($58,474, a difference of 1.3%), Immigrants from India ($60,648, a difference of 2.4%), and Immigrants from Iran ($57,612, a difference of 2.8%).
| Demographics | Rating | Rank | Median Earnings |
| Filipinos | 100.0 /100 | #1 | Exceptional $61,197 |
| Immigrants | Taiwan | 100.0 /100 | #2 | Exceptional $61,151 |
| Immigrants | India | 100.0 /100 | #3 | Exceptional $60,648 |
| Immigrants | Hong Kong | 100.0 /100 | #4 | Exceptional $59,433 |
| Thais | 100.0 /100 | #5 | Exceptional $59,237 |
| Immigrants | Singapore | 100.0 /100 | #6 | Exceptional $59,038 |
| Iranians | 100.0 /100 | #7 | Exceptional $58,474 |
| Immigrants | Iran | 100.0 /100 | #8 | Exceptional $57,612 |
| Okinawans | 100.0 /100 | #9 | Exceptional $57,550 |
| Immigrants | South Central Asia | 100.0 /100 | #10 | Exceptional $57,114 |
| Immigrants | Israel | 100.0 /100 | #11 | Exceptional $57,034 |
| Immigrants | Ireland | 100.0 /100 | #12 | Exceptional $56,854 |
| Immigrants | China | 100.0 /100 | #13 | Exceptional $56,638 |
| Immigrants | Australia | 100.0 /100 | #14 | Exceptional $56,305 |
| Indians (Asian) | 100.0 /100 | #15 | Exceptional $56,253 |