Immigrants from Scotland vs Paraguayan Median Household Income
COMPARE
Immigrants from Scotland
Paraguayan
Median Household Income
Median Household Income Comparison
Immigrants from Scotland
Paraguayans
$94,091
MEDIAN HOUSEHOLD INCOME
99.7/ 100
METRIC RATING
67th/ 347
METRIC RANK
$95,737
MEDIAN HOUSEHOLD INCOME
99.9/ 100
METRIC RATING
53rd/ 347
METRIC RANK
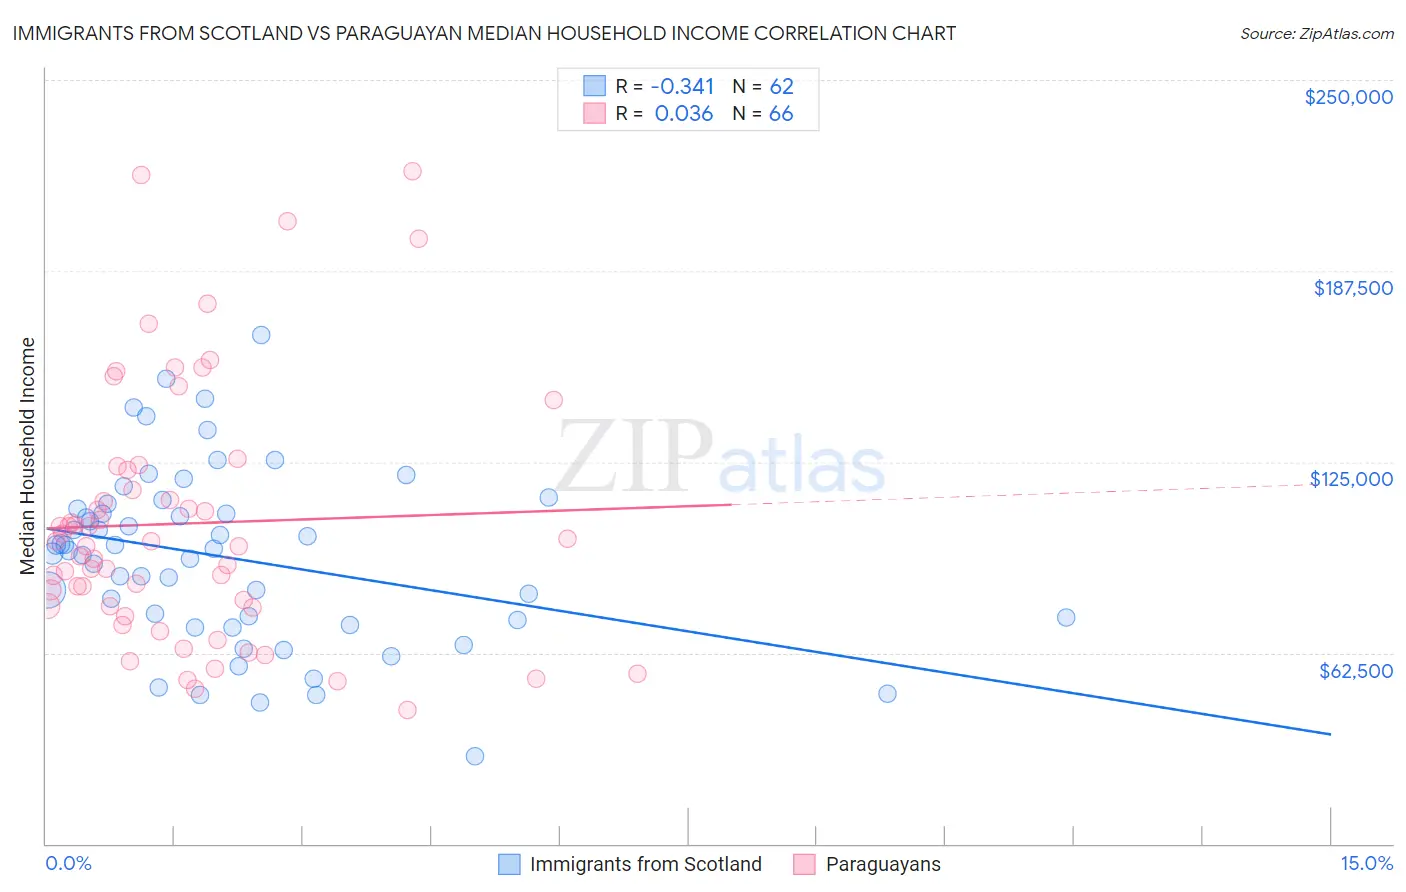
Immigrants from Scotland vs Paraguayan Median Household Income Correlation Chart
The statistical analysis conducted on geographies consisting of 196,370,497 people shows a mild negative correlation between the proportion of Immigrants from Scotland and median household income in the United States with a correlation coefficient (R) of -0.341 and weighted average of $94,091. Similarly, the statistical analysis conducted on geographies consisting of 95,096,064 people shows no correlation between the proportion of Paraguayans and median household income in the United States with a correlation coefficient (R) of 0.036 and weighted average of $95,737, a difference of 1.8%.
Median Household Income Correlation Summary
| Measurement | Immigrants from Scotland | Paraguayan |
| Minimum | $28,750 | $43,906 |
| Maximum | $166,597 | $220,060 |
| Range | $137,847 | $176,154 |
| Mean | $93,595 | $104,819 |
| Median | $96,232 | $98,291 |
| Interquartile 25% (IQ1) | $73,269 | $77,788 |
| Interquartile 75% (IQ3) | $109,596 | $122,293 |
| Interquartile Range (IQR) | $36,327 | $44,505 |
| Standard Deviation (Sample) | $28,531 | $41,190 |
| Standard Deviation (Population) | $28,300 | $40,877 |
Demographics Similar to Immigrants from Scotland and Paraguayans by Median Household Income
In terms of median household income, the demographic groups most similar to Immigrants from Scotland are Mongolian ($93,971, a difference of 0.13%), Immigrants from Romania ($94,222, a difference of 0.14%), Argentinean ($93,960, a difference of 0.14%), Immigrants from Fiji ($93,933, a difference of 0.17%), and Immigrants from Belarus ($94,399, a difference of 0.33%). Similarly, the demographic groups most similar to Paraguayans are Immigrants from South Africa ($95,800, a difference of 0.070%), Egyptian ($95,673, a difference of 0.070%), Estonian ($95,930, a difference of 0.20%), Immigrants from Czechoslovakia ($95,319, a difference of 0.44%), and Immigrants from Austria ($95,277, a difference of 0.48%).
| Demographics | Rating | Rank | Median Household Income |
| Bulgarians | 99.9 /100 | #50 | Exceptional $96,290 |
| Estonians | 99.9 /100 | #51 | Exceptional $95,930 |
| Immigrants | South Africa | 99.9 /100 | #52 | Exceptional $95,800 |
| Paraguayans | 99.9 /100 | #53 | Exceptional $95,737 |
| Egyptians | 99.9 /100 | #54 | Exceptional $95,673 |
| Immigrants | Czechoslovakia | 99.9 /100 | #55 | Exceptional $95,319 |
| Immigrants | Austria | 99.9 /100 | #56 | Exceptional $95,277 |
| New Zealanders | 99.8 /100 | #57 | Exceptional $95,146 |
| Soviet Union | 99.8 /100 | #58 | Exceptional $95,098 |
| Immigrants | Europe | 99.8 /100 | #59 | Exceptional $95,032 |
| Koreans | 99.8 /100 | #60 | Exceptional $95,018 |
| Laotians | 99.8 /100 | #61 | Exceptional $94,990 |
| Immigrants | Norway | 99.8 /100 | #62 | Exceptional $94,846 |
| Greeks | 99.8 /100 | #63 | Exceptional $94,735 |
| Immigrants | Netherlands | 99.7 /100 | #64 | Exceptional $94,411 |
| Immigrants | Belarus | 99.7 /100 | #65 | Exceptional $94,399 |
| Immigrants | Romania | 99.7 /100 | #66 | Exceptional $94,222 |
| Immigrants | Scotland | 99.7 /100 | #67 | Exceptional $94,091 |
| Mongolians | 99.7 /100 | #68 | Exceptional $93,971 |
| Argentineans | 99.7 /100 | #69 | Exceptional $93,960 |
| Immigrants | Fiji | 99.7 /100 | #70 | Exceptional $93,933 |