Venezuelan vs Paraguayan Median Household Income
COMPARE
Venezuelan
Paraguayan
Median Household Income
Median Household Income Comparison
Venezuelans
Paraguayans
$82,432
MEDIAN HOUSEHOLD INCOME
15.3/ 100
METRIC RATING
212th/ 347
METRIC RANK
$95,737
MEDIAN HOUSEHOLD INCOME
99.9/ 100
METRIC RATING
53rd/ 347
METRIC RANK
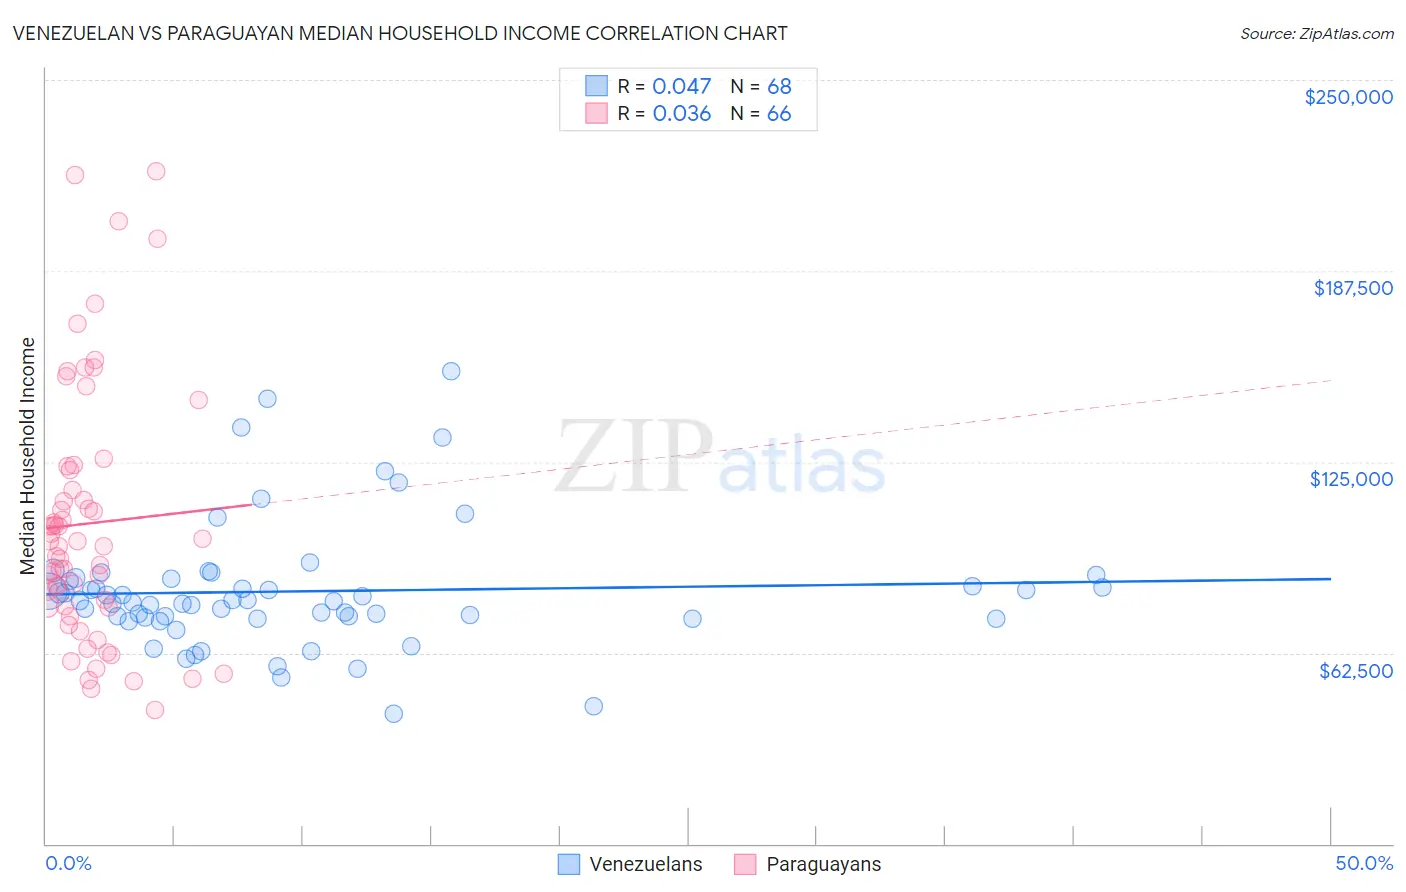
Venezuelan vs Paraguayan Median Household Income Correlation Chart
The statistical analysis conducted on geographies consisting of 306,067,078 people shows no correlation between the proportion of Venezuelans and median household income in the United States with a correlation coefficient (R) of 0.047 and weighted average of $82,432. Similarly, the statistical analysis conducted on geographies consisting of 95,096,064 people shows no correlation between the proportion of Paraguayans and median household income in the United States with a correlation coefficient (R) of 0.036 and weighted average of $95,737, a difference of 16.1%.
Median Household Income Correlation Summary
| Measurement | Venezuelan | Paraguayan |
| Minimum | $42,664 | $43,906 |
| Maximum | $154,652 | $220,060 |
| Range | $111,988 | $176,154 |
| Mean | $82,593 | $104,819 |
| Median | $79,442 | $98,291 |
| Interquartile 25% (IQ1) | $73,873 | $77,788 |
| Interquartile 75% (IQ3) | $86,330 | $122,293 |
| Interquartile Range (IQR) | $12,458 | $44,505 |
| Standard Deviation (Sample) | $20,652 | $41,190 |
| Standard Deviation (Population) | $20,500 | $40,877 |
Similar Demographics by Median Household Income
Demographics Similar to Venezuelans by Median Household Income
In terms of median household income, the demographic groups most similar to Venezuelans are Salvadoran ($82,449, a difference of 0.020%), Nepalese ($82,410, a difference of 0.030%), Immigrants from Uruguay ($82,560, a difference of 0.16%), Immigrants from Iraq ($82,594, a difference of 0.20%), and Panamanian ($82,272, a difference of 0.20%).
| Demographics | Rating | Rank | Median Household Income |
| Celtics | 22.7 /100 | #205 | Fair $83,193 |
| Immigrants | Kenya | 21.3 /100 | #206 | Fair $83,068 |
| Dutch | 20.3 /100 | #207 | Fair $82,971 |
| French Canadians | 18.7 /100 | #208 | Poor $82,810 |
| Immigrants | Iraq | 16.7 /100 | #209 | Poor $82,594 |
| Immigrants | Uruguay | 16.4 /100 | #210 | Poor $82,560 |
| Salvadorans | 15.4 /100 | #211 | Poor $82,449 |
| Venezuelans | 15.3 /100 | #212 | Poor $82,432 |
| Nepalese | 15.1 /100 | #213 | Poor $82,410 |
| Panamanians | 14.0 /100 | #214 | Poor $82,272 |
| Vietnamese | 13.8 /100 | #215 | Poor $82,248 |
| Yugoslavians | 13.3 /100 | #216 | Poor $82,186 |
| Ecuadorians | 12.5 /100 | #217 | Poor $82,070 |
| Whites/Caucasians | 12.2 /100 | #218 | Poor $82,029 |
| Nigerians | 10.3 /100 | #219 | Poor $81,725 |
Demographics Similar to Paraguayans by Median Household Income
In terms of median household income, the demographic groups most similar to Paraguayans are Immigrants from South Africa ($95,800, a difference of 0.070%), Egyptian ($95,673, a difference of 0.070%), Estonian ($95,930, a difference of 0.20%), Immigrants from Czechoslovakia ($95,319, a difference of 0.44%), and Immigrants from Austria ($95,277, a difference of 0.48%).
| Demographics | Rating | Rank | Median Household Income |
| Australians | 99.9 /100 | #46 | Exceptional $96,490 |
| Immigrants | Russia | 99.9 /100 | #47 | Exceptional $96,378 |
| Cambodians | 99.9 /100 | #48 | Exceptional $96,324 |
| Immigrants | Malaysia | 99.9 /100 | #49 | Exceptional $96,292 |
| Bulgarians | 99.9 /100 | #50 | Exceptional $96,290 |
| Estonians | 99.9 /100 | #51 | Exceptional $95,930 |
| Immigrants | South Africa | 99.9 /100 | #52 | Exceptional $95,800 |
| Paraguayans | 99.9 /100 | #53 | Exceptional $95,737 |
| Egyptians | 99.9 /100 | #54 | Exceptional $95,673 |
| Immigrants | Czechoslovakia | 99.9 /100 | #55 | Exceptional $95,319 |
| Immigrants | Austria | 99.9 /100 | #56 | Exceptional $95,277 |
| New Zealanders | 99.8 /100 | #57 | Exceptional $95,146 |
| Soviet Union | 99.8 /100 | #58 | Exceptional $95,098 |
| Immigrants | Europe | 99.8 /100 | #59 | Exceptional $95,032 |
| Koreans | 99.8 /100 | #60 | Exceptional $95,018 |