Peruvian vs Paraguayan Householder Income Ages 45 - 64 years
COMPARE
Peruvian
Paraguayan
Householder Income Ages 45 - 64 years
Householder Income Ages 45 - 64 years Comparison
Peruvians
Paraguayans
$105,070
HOUSEHOLDER INCOME AGES 45 - 64 YEARS
91.5/ 100
METRIC RATING
129th/ 347
METRIC RANK
$109,447
HOUSEHOLDER INCOME AGES 45 - 64 YEARS
99.0/ 100
METRIC RATING
76th/ 347
METRIC RANK
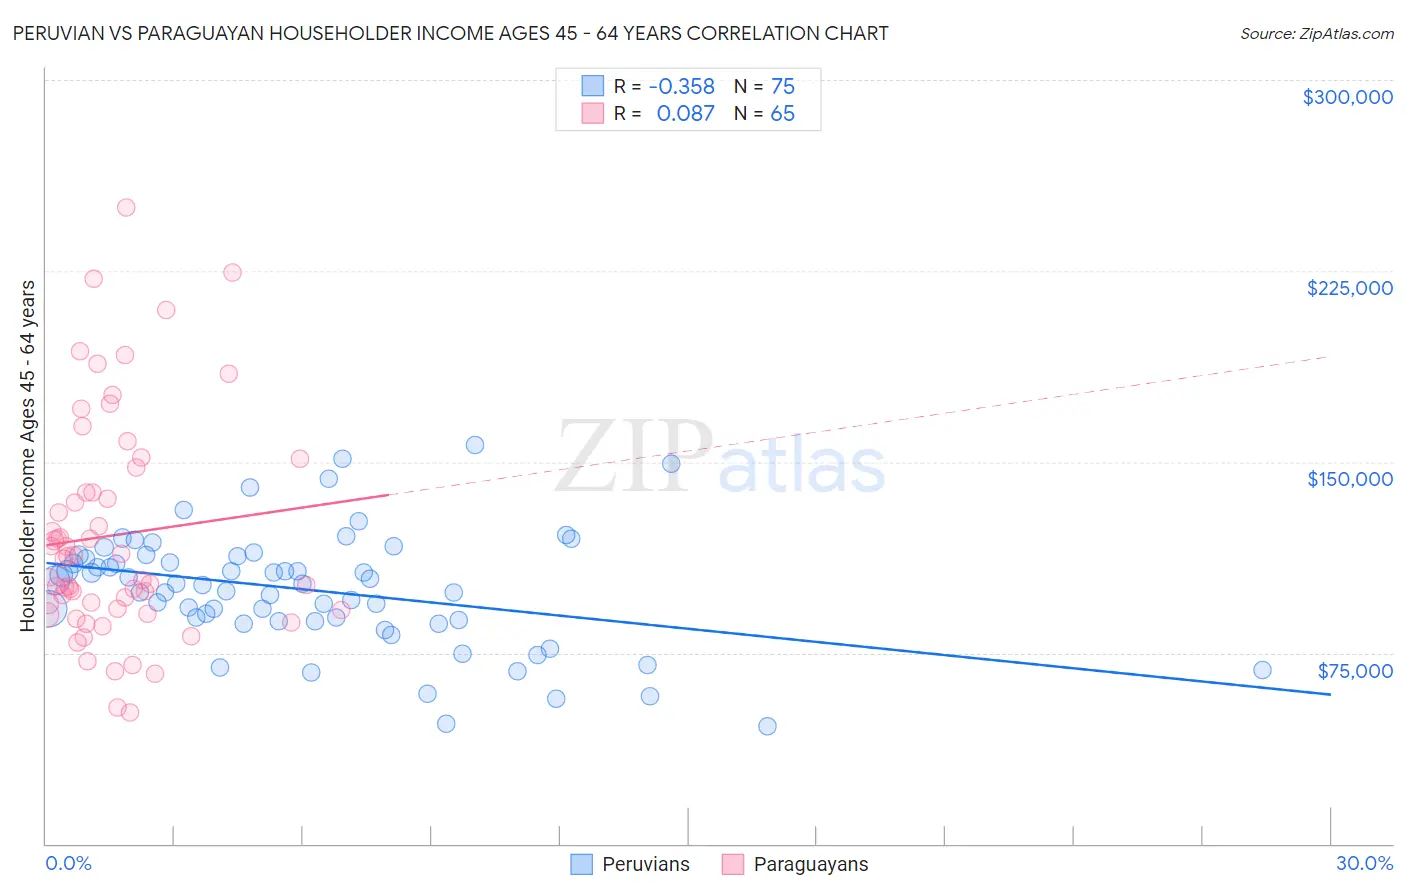
Peruvian vs Paraguayan Householder Income Ages 45 - 64 years Correlation Chart
The statistical analysis conducted on geographies consisting of 362,640,242 people shows a mild negative correlation between the proportion of Peruvians and household income with householder between the ages 45 and 64 in the United States with a correlation coefficient (R) of -0.358 and weighted average of $105,070. Similarly, the statistical analysis conducted on geographies consisting of 95,076,993 people shows a slight positive correlation between the proportion of Paraguayans and household income with householder between the ages 45 and 64 in the United States with a correlation coefficient (R) of 0.087 and weighted average of $109,447, a difference of 4.2%.
Householder Income Ages 45 - 64 years Correlation Summary
| Measurement | Peruvian | Paraguayan |
| Minimum | $46,375 | $51,563 |
| Maximum | $156,818 | $250,001 |
| Range | $110,443 | $198,438 |
| Mean | $99,765 | $121,175 |
| Median | $101,930 | $112,144 |
| Interquartile 25% (IQ1) | $87,436 | $91,944 |
| Interquartile 75% (IQ3) | $112,777 | $142,851 |
| Interquartile Range (IQR) | $25,341 | $50,906 |
| Standard Deviation (Sample) | $22,661 | $43,262 |
| Standard Deviation (Population) | $22,510 | $42,927 |
Similar Demographics by Householder Income Ages 45 - 64 years
Demographics Similar to Peruvians by Householder Income Ages 45 - 64 years
In terms of householder income ages 45 - 64 years, the demographic groups most similar to Peruvians are Immigrants from Zimbabwe ($104,992, a difference of 0.070%), Native Hawaiian ($105,149, a difference of 0.080%), Immigrants from Saudi Arabia ($105,249, a difference of 0.17%), Immigrants from Syria ($104,858, a difference of 0.20%), and Pakistani ($105,317, a difference of 0.23%).
| Demographics | Rating | Rank | Householder Income Ages 45 - 64 years |
| Immigrants | North Macedonia | 94.2 /100 | #122 | Exceptional $105,892 |
| Danes | 93.4 /100 | #123 | Exceptional $105,619 |
| Immigrants | Northern Africa | 92.8 /100 | #124 | Exceptional $105,430 |
| Pakistanis | 92.4 /100 | #125 | Exceptional $105,317 |
| Portuguese | 92.4 /100 | #126 | Exceptional $105,309 |
| Immigrants | Saudi Arabia | 92.2 /100 | #127 | Exceptional $105,249 |
| Native Hawaiians | 91.8 /100 | #128 | Exceptional $105,149 |
| Peruvians | 91.5 /100 | #129 | Exceptional $105,070 |
| Immigrants | Zimbabwe | 91.2 /100 | #130 | Exceptional $104,992 |
| Immigrants | Syria | 90.7 /100 | #131 | Exceptional $104,858 |
| Lebanese | 90.1 /100 | #132 | Exceptional $104,734 |
| Arabs | 89.3 /100 | #133 | Excellent $104,566 |
| Canadians | 89.3 /100 | #134 | Excellent $104,560 |
| Brazilians | 88.6 /100 | #135 | Excellent $104,408 |
| Taiwanese | 87.4 /100 | #136 | Excellent $104,180 |
Demographics Similar to Paraguayans by Householder Income Ages 45 - 64 years
In terms of householder income ages 45 - 64 years, the demographic groups most similar to Paraguayans are Immigrants from England ($109,446, a difference of 0.0%), Immigrants from Canada ($109,402, a difference of 0.040%), Immigrants from Bulgaria ($109,379, a difference of 0.060%), Jordanian ($109,376, a difference of 0.060%), and Immigrants from Eastern Europe ($109,335, a difference of 0.10%).
| Demographics | Rating | Rank | Householder Income Ages 45 - 64 years |
| Immigrants | Italy | 99.4 /100 | #69 | Exceptional $110,434 |
| Koreans | 99.3 /100 | #70 | Exceptional $110,334 |
| Italians | 99.3 /100 | #71 | Exceptional $110,224 |
| Assyrians/Chaldeans/Syriacs | 99.3 /100 | #72 | Exceptional $110,201 |
| Argentineans | 99.3 /100 | #73 | Exceptional $110,103 |
| Immigrants | Egypt | 99.2 /100 | #74 | Exceptional $109,941 |
| South Africans | 99.1 /100 | #75 | Exceptional $109,719 |
| Paraguayans | 99.0 /100 | #76 | Exceptional $109,447 |
| Immigrants | England | 99.0 /100 | #77 | Exceptional $109,446 |
| Immigrants | Canada | 99.0 /100 | #78 | Exceptional $109,402 |
| Immigrants | Bulgaria | 98.9 /100 | #79 | Exceptional $109,379 |
| Jordanians | 98.9 /100 | #80 | Exceptional $109,376 |
| Immigrants | Eastern Europe | 98.9 /100 | #81 | Exceptional $109,335 |
| Immigrants | North America | 98.8 /100 | #82 | Exceptional $109,198 |
| Immigrants | Spain | 98.8 /100 | #83 | Exceptional $109,051 |