Haitian vs Paraguayan Median Household Income
COMPARE
Haitian
Paraguayan
Median Household Income
Median Household Income Comparison
Haitians
Paraguayans
$73,306
MEDIAN HOUSEHOLD INCOME
0.1/ 100
METRIC RATING
296th/ 347
METRIC RANK
$95,737
MEDIAN HOUSEHOLD INCOME
99.9/ 100
METRIC RATING
53rd/ 347
METRIC RANK
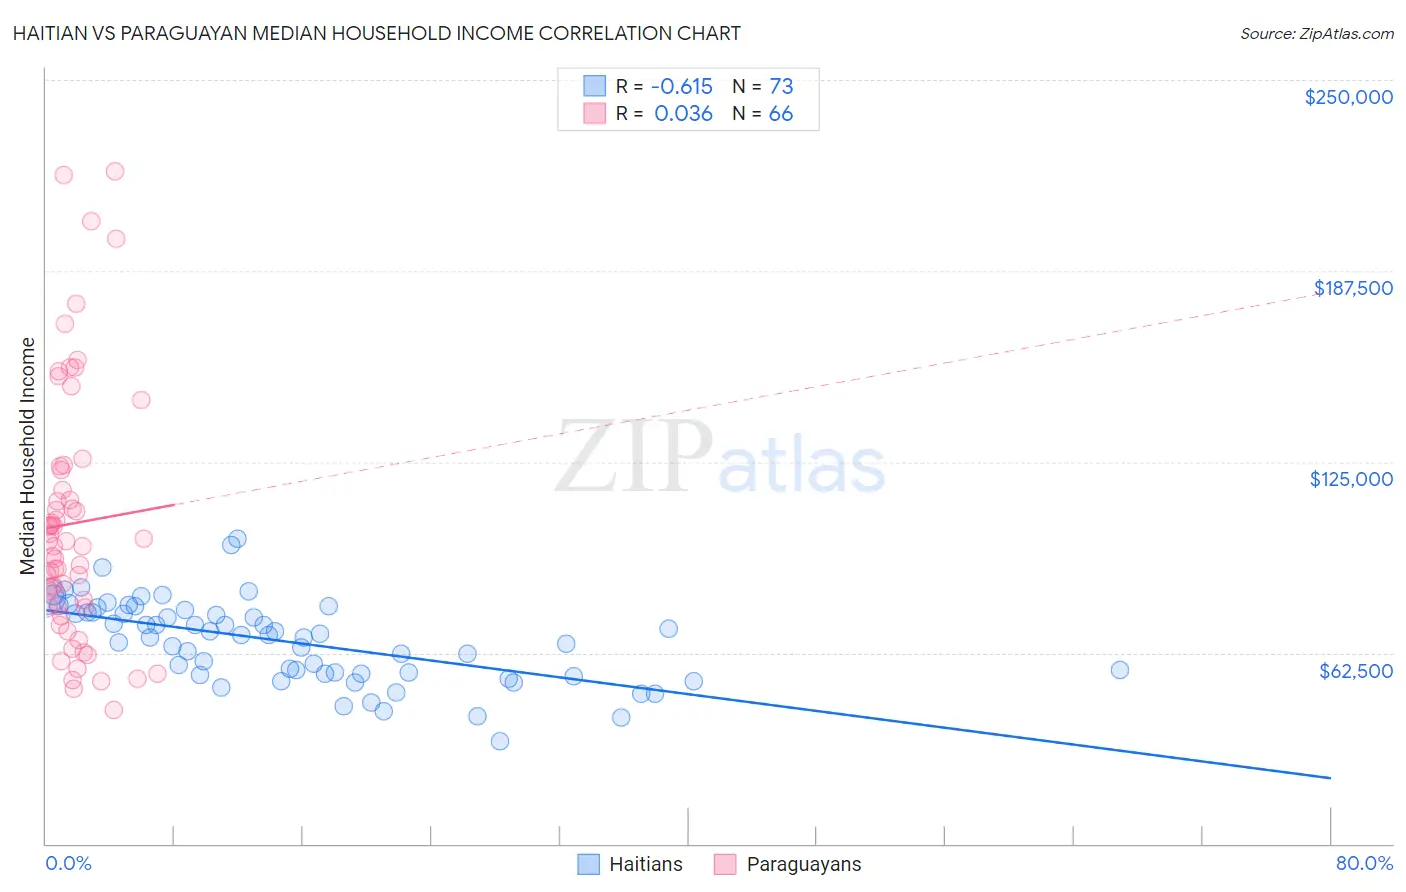
Haitian vs Paraguayan Median Household Income Correlation Chart
The statistical analysis conducted on geographies consisting of 287,615,576 people shows a significant negative correlation between the proportion of Haitians and median household income in the United States with a correlation coefficient (R) of -0.615 and weighted average of $73,306. Similarly, the statistical analysis conducted on geographies consisting of 95,096,064 people shows no correlation between the proportion of Paraguayans and median household income in the United States with a correlation coefficient (R) of 0.036 and weighted average of $95,737, a difference of 30.6%.
Median Household Income Correlation Summary
| Measurement | Haitian | Paraguayan |
| Minimum | $33,629 | $43,906 |
| Maximum | $99,911 | $220,060 |
| Range | $66,282 | $176,154 |
| Mean | $66,249 | $104,819 |
| Median | $68,171 | $98,291 |
| Interquartile 25% (IQ1) | $55,796 | $77,788 |
| Interquartile 75% (IQ3) | $76,109 | $122,293 |
| Interquartile Range (IQR) | $20,312 | $44,505 |
| Standard Deviation (Sample) | $13,488 | $41,190 |
| Standard Deviation (Population) | $13,395 | $40,877 |
Similar Demographics by Median Household Income
Demographics Similar to Haitians by Median Household Income
In terms of median household income, the demographic groups most similar to Haitians are Cuban ($73,392, a difference of 0.12%), Immigrants from Mexico ($73,160, a difference of 0.20%), Blackfeet ($73,509, a difference of 0.28%), Immigrants from Cabo Verde ($73,515, a difference of 0.29%), and Paiute ($72,959, a difference of 0.48%).
| Demographics | Rating | Rank | Median Household Income |
| Fijians | 0.1 /100 | #289 | Tragic $74,205 |
| Bangladeshis | 0.1 /100 | #290 | Tragic $74,112 |
| Hispanics or Latinos | 0.1 /100 | #291 | Tragic $73,823 |
| Comanche | 0.1 /100 | #292 | Tragic $73,747 |
| Immigrants | Cabo Verde | 0.1 /100 | #293 | Tragic $73,515 |
| Blackfeet | 0.1 /100 | #294 | Tragic $73,509 |
| Cubans | 0.1 /100 | #295 | Tragic $73,392 |
| Haitians | 0.1 /100 | #296 | Tragic $73,306 |
| Immigrants | Mexico | 0.0 /100 | #297 | Tragic $73,160 |
| Paiute | 0.0 /100 | #298 | Tragic $72,959 |
| Indonesians | 0.0 /100 | #299 | Tragic $72,856 |
| Immigrants | Dominica | 0.0 /100 | #300 | Tragic $72,760 |
| Cherokee | 0.0 /100 | #301 | Tragic $72,682 |
| Shoshone | 0.0 /100 | #302 | Tragic $72,660 |
| Africans | 0.0 /100 | #303 | Tragic $72,650 |
Demographics Similar to Paraguayans by Median Household Income
In terms of median household income, the demographic groups most similar to Paraguayans are Immigrants from South Africa ($95,800, a difference of 0.070%), Egyptian ($95,673, a difference of 0.070%), Estonian ($95,930, a difference of 0.20%), Immigrants from Czechoslovakia ($95,319, a difference of 0.44%), and Immigrants from Austria ($95,277, a difference of 0.48%).
| Demographics | Rating | Rank | Median Household Income |
| Australians | 99.9 /100 | #46 | Exceptional $96,490 |
| Immigrants | Russia | 99.9 /100 | #47 | Exceptional $96,378 |
| Cambodians | 99.9 /100 | #48 | Exceptional $96,324 |
| Immigrants | Malaysia | 99.9 /100 | #49 | Exceptional $96,292 |
| Bulgarians | 99.9 /100 | #50 | Exceptional $96,290 |
| Estonians | 99.9 /100 | #51 | Exceptional $95,930 |
| Immigrants | South Africa | 99.9 /100 | #52 | Exceptional $95,800 |
| Paraguayans | 99.9 /100 | #53 | Exceptional $95,737 |
| Egyptians | 99.9 /100 | #54 | Exceptional $95,673 |
| Immigrants | Czechoslovakia | 99.9 /100 | #55 | Exceptional $95,319 |
| Immigrants | Austria | 99.9 /100 | #56 | Exceptional $95,277 |
| New Zealanders | 99.8 /100 | #57 | Exceptional $95,146 |
| Soviet Union | 99.8 /100 | #58 | Exceptional $95,098 |
| Immigrants | Europe | 99.8 /100 | #59 | Exceptional $95,032 |
| Koreans | 99.8 /100 | #60 | Exceptional $95,018 |