Peruvian vs Paraguayan Male Poverty

COMPARE

Peruvian
Race
Ancestry
AfghanAfricanAlaska NativeAlaskan AthabascanAlbanianAleutAlsatianAmericanApacheArabArapahoArgentineanArmenianAssyrian/Chaldean/SyriacAustralianAustrianBahamianBangladeshiBarbadianBasqueBelgianBelizeanBermudanBhutaneseBlackfeetBolivianBrazilianBritishBritish West IndianBulgarianBurmeseCajunCambodianCanadianCape VerdeanCarpatho RusynCelticCentral AmericanCentral American IndianCherokeeCheyenneChickasawChileanChineseChippewaChoctawColombianColvilleComancheCosta RicanCreeCreekCroatianCrowCubanCypriotCzechCzechoslovakianDanishDelawareDominicanDutchDutch West IndianEastern EuropeanEcuadorianEgyptianEnglishEstonianEthiopianEuropeanFijianFilipinoFinnishFrenchFrench American IndianFrench CanadianGermanGerman RussianGhanaianGreekGuamanian/ChamorroGuatemalanGuyaneseHaitianHmongHonduranHopiHoumaHungarianIcelanderIndian (Asian)IndonesianInupiatIranianIraqiIrishIroquoisIsraeliItalianJamaicanJapaneseJordanianKenyanKiowaKoreanLaotianLatvianLebaneseLiberianLithuanianLumbeeLuxembourgerMacedonianMalaysianMalteseMarshalleseMenomineeMexicanMexican American IndianMongolianMoroccanNative HawaiianNavajoNepaleseNew ZealanderNicaraguanNigerianNorthern EuropeanNorwegianOkinawanOsageOttawaPaiutePakistaniPalestinianPanamanianPennsylvania GermanPeruvianPimaPolishPortuguesePotawatomiPuebloPuerto RicanPuget Sound SalishRomanianRussianSalvadoranSamoanScandinavianScotch-IrishScottishSeminoleSenegaleseSerbianShoshoneSierra LeoneanSiouxSlavicSlovakSloveneSomaliSouth AfricanSouth AmericanSouth American IndianSoviet UnionSpaniardSpanishSpanish AmericanSpanish American IndianSri LankanSubsaharan AfricanSudaneseSwedishSwissSyrianTaiwaneseThaiTlingit-HaidaTohono O'OdhamTonganTrinidadian and TobagonianTsimshianTurkishU.S. Virgin IslanderUgandanUkrainianUruguayanUteVenezuelanVietnameseWelshWest IndianYakamaYaquiYugoslavianYumanYup'ikZimbabwean
Immigration
NonimmigrantsImmigrantsAfghanistanAfricaAlbaniaArgentinaArmeniaAsiaAustraliaAustriaBahamasBangladeshBarbadosBelarusBelgiumBelizeBoliviaBosnia and HerzegovinaBrazilBulgariaBurma/MyanmarCabo VerdeCambodiaCameroonCanadaCaribbeanCentral AmericaChileChinaColombiaCongoCosta RicaCroatiaCubaCzechoslovakiaDenmarkDominicaDominican RepublicEastern AfricaEastern AsiaEastern EuropeEcuadorEgyptEl SalvadorEnglandEritreaEthiopiaEuropeFijiFranceGermanyGhanaGreeceGrenadaGuatemalaGuyanaHaitiHondurasHong KongHungaryIndiaIndonesiaIranIraqIrelandIsraelItalyJamaicaJapanJordanKazakhstanKenyaKoreaKuwaitLaosLatin AmericaLatviaLebanonLiberiaLithuaniaMalaysiaMexicoMicronesiaMiddle AfricaMoldovaMoroccoNepalNetherlandsNicaraguaNigeriaNorth AmericaNorth MacedoniaNorthern AfricaNorthern EuropeNorwayOceaniaPakistanPanamaPeruPhilippinesPolandPortugalRomaniaRussiaSaudi ArabiaScotlandSenegalSerbiaSierra LeoneSingaporeSomaliaSouth AfricaSouth AmericaSouth Central AsiaSouth Eastern AsiaSouthern EuropeSpainSri LankaSt. Vincent and the GrenadinesSudanSwedenSwitzerlandSyriaTaiwanThailandTrinidad and TobagoTurkeyUgandaUkraineUruguayUzbekistanVenezuelaVietnamWest IndiesWestern AfricaWestern AsiaWestern EuropeYemenZaireZimbabweAzores
Paraguayan
Race
Ancestry
AfghanAfricanAlaska NativeAlaskan AthabascanAlbanianAleutAlsatianAmericanApacheArabArapahoArgentineanArmenianAssyrian/Chaldean/SyriacAustralianAustrianBahamianBangladeshiBarbadianBasqueBelgianBelizeanBermudanBhutaneseBlackfeetBolivianBrazilianBritishBritish West IndianBulgarianBurmeseCajunCambodianCanadianCape VerdeanCarpatho RusynCelticCentral AmericanCentral American IndianCherokeeCheyenneChickasawChileanChineseChippewaChoctawColombianColvilleComancheCosta RicanCreeCreekCroatianCrowCubanCypriotCzechCzechoslovakianDanishDelawareDominicanDutchDutch West IndianEastern EuropeanEcuadorianEgyptianEnglishEstonianEthiopianEuropeanFijianFilipinoFinnishFrenchFrench American IndianFrench CanadianGermanGerman RussianGhanaianGreekGuamanian/ChamorroGuatemalanGuyaneseHaitianHmongHonduranHopiHoumaHungarianIcelanderIndian (Asian)IndonesianInupiatIranianIraqiIrishIroquoisIsraeliItalianJamaicanJapaneseJordanianKenyanKiowaKoreanLaotianLatvianLebaneseLiberianLithuanianLumbeeLuxembourgerMacedonianMalaysianMalteseMarshalleseMenomineeMexicanMexican American IndianMongolianMoroccanNative HawaiianNavajoNepaleseNew ZealanderNicaraguanNigerianNorthern EuropeanNorwegianOkinawanOsageOttawaPaiutePakistaniPalestinianPanamanianParaguayanPennsylvania GermanPimaPolishPortuguesePotawatomiPuebloPuerto RicanPuget Sound SalishRomanianRussianSalvadoranSamoanScandinavianScotch-IrishScottishSeminoleSenegaleseSerbianShoshoneSierra LeoneanSiouxSlavicSlovakSloveneSomaliSouth AfricanSouth AmericanSouth American IndianSoviet UnionSpaniardSpanishSpanish AmericanSpanish American IndianSri LankanSubsaharan AfricanSudaneseSwedishSwissSyrianTaiwaneseThaiTlingit-HaidaTohono O'OdhamTonganTrinidadian and TobagonianTsimshianTurkishU.S. Virgin IslanderUgandanUkrainianUruguayanUteVenezuelanVietnameseWelshWest IndianYakamaYaquiYugoslavianYumanYup'ikZimbabwean
Immigration
NonimmigrantsImmigrantsAfghanistanAfricaAlbaniaArgentinaArmeniaAsiaAustraliaAustriaBahamasBangladeshBarbadosBelarusBelgiumBelizeBoliviaBosnia and HerzegovinaBrazilBulgariaBurma/MyanmarCabo VerdeCambodiaCameroonCanadaCaribbeanCentral AmericaChileChinaColombiaCongoCosta RicaCroatiaCubaCzechoslovakiaDenmarkDominicaDominican RepublicEastern AfricaEastern AsiaEastern EuropeEcuadorEgyptEl SalvadorEnglandEritreaEthiopiaEuropeFijiFranceGermanyGhanaGreeceGrenadaGuatemalaGuyanaHaitiHondurasHong KongHungaryIndiaIndonesiaIranIraqIrelandIsraelItalyJamaicaJapanJordanKazakhstanKenyaKoreaKuwaitLaosLatin AmericaLatviaLebanonLiberiaLithuaniaMalaysiaMexicoMicronesiaMiddle AfricaMoldovaMoroccoNepalNetherlandsNicaraguaNigeriaNorth AmericaNorth MacedoniaNorthern AfricaNorthern EuropeNorwayOceaniaPakistanPanamaPeruPhilippinesPolandPortugalRomaniaRussiaSaudi ArabiaScotlandSenegalSerbiaSierra LeoneSingaporeSomaliaSouth AfricaSouth AmericaSouth Central AsiaSouth Eastern AsiaSouthern EuropeSpainSri LankaSt. Vincent and the GrenadinesSudanSwedenSwitzerlandSyriaTaiwanThailandTrinidad and TobagoTurkeyUgandaUkraineUruguayUzbekistanVenezuelaVietnamWest IndiesWestern AfricaWestern AsiaWestern EuropeYemenZaireZimbabweAzores
Male Poverty
Income
Poverty
Unemployment
Labor Participation
Family Structure
Vehicle Availability
Education Level
Disability

Male Poverty Comparison

Peruvians

Paraguayans

Excellent
Exceptional
10.7%
MALE POVERTY
87.1/ 100
METRIC RATING
121st/ 347
METRIC RANK
10.2%
MALE POVERTY
97.1/ 100
METRIC RATING
70th/ 347
METRIC RANK

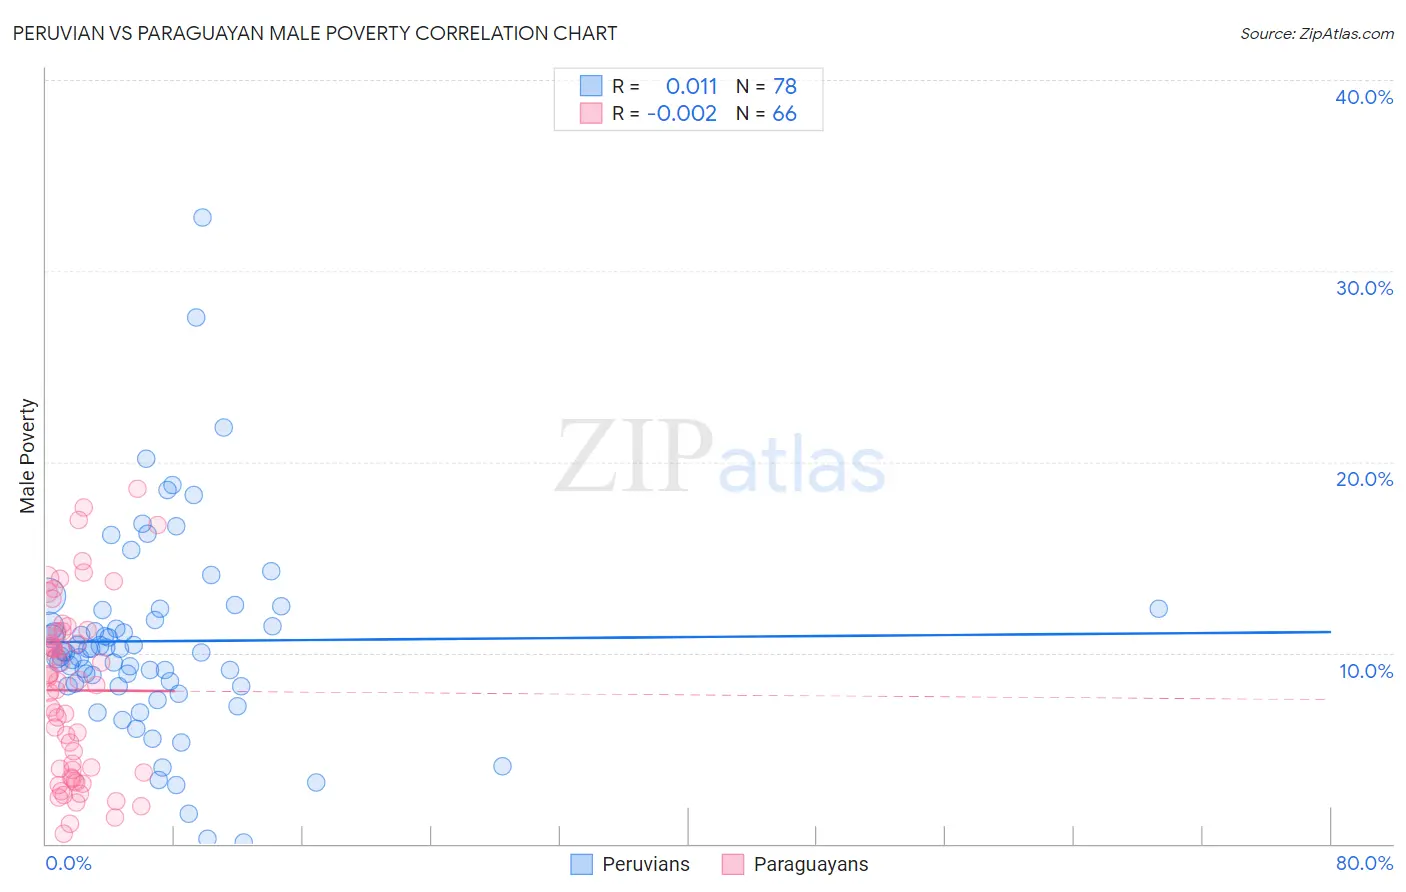
Peruvian vs Paraguayan Male Poverty Correlation Chart

The statistical analysis conducted on geographies consisting of 362,866,213 people shows no correlation between the proportion of Peruvians and poverty level among males in the United States with a correlation coefficient (R) of 0.011 and weighted average of 10.7%. Similarly, the statistical analysis conducted on geographies consisting of 95,091,080 people shows no correlation between the proportion of Paraguayans and poverty level among males in the United States with a correlation coefficient (R) of -0.002 and weighted average of 10.2%, a difference of 4.3%.
Peruvian vs Paraguayan Male Poverty

Male Poverty Correlation Summary

MeasurementPeruvianParaguayan
Minimum0.066%0.50%
Maximum32.8%18.6%
Range32.7%18.1%
Mean10.6%8.0%
Median10.1%8.4%
Interquartile 25% (IQ1)8.3%3.8%
Interquartile 75% (IQ3)12.3%11.1%
Interquartile Range (IQR)4.0%7.4%
Standard Deviation (Sample)5.3%4.6%
Standard Deviation (Population)5.2%4.5%

Similar Demographics by Male Poverty

Demographics Similar to Peruvians by Male Poverty

In terms of male poverty, the demographic groups most similar to Peruvians are Immigrants from China (10.7%, a difference of 0.010%), Native Hawaiian (10.7%, a difference of 0.020%), South African (10.7%, a difference of 0.060%), French (10.7%, a difference of 0.080%), and Immigrants from Hungary (10.7%, a difference of 0.11%).
DemographicsRating | RankMale Poverty
Immigrants | Brazil
89.0
/100
|
#114
Excellent
10.6%
Immigrants | Russia
88.6
/100
|
#115
Excellent
10.6%
Sri Lankans
88.1
/100
|
#116
Excellent
10.6%
Immigrants | South Eastern Asia
88.1
/100
|
#117
Excellent
10.6%
Okinawans
87.6
/100
|
#118
Excellent
10.7%
Immigrants | Hungary
87.6
/100
|
#119
Excellent
10.7%
Immigrants | China
87.1
/100
|
#120
Excellent
10.7%
Peruvians
87.1
/100
|
#121
Excellent
10.7%
Native Hawaiians
87.0
/100
|
#122
Excellent
10.7%
South Africans
86.8
/100
|
#123
Excellent
10.7%
French
86.7
/100
|
#124
Excellent
10.7%
Immigrants | Norway
86.0
/100
|
#125
Excellent
10.7%
Immigrants | Ukraine
84.3
/100
|
#126
Excellent
10.7%
Puget Sound Salish
84.3
/100
|
#127
Excellent
10.7%
Immigrants | Western Europe
84.2
/100
|
#128
Excellent
10.7%

Demographics Similar to Paraguayans by Male Poverty

In terms of male poverty, the demographic groups most similar to Paraguayans are Immigrants from Australia (10.2%, a difference of 0.020%), European (10.2%, a difference of 0.030%), Immigrants from Canada (10.2%, a difference of 0.030%), Immigrants from Asia (10.2%, a difference of 0.12%), and Immigrants from Sri Lanka (10.2%, a difference of 0.15%).
DemographicsRating | RankMale Poverty
Slovaks
97.7
/100
|
#63
Exceptional
10.2%
Swiss
97.5
/100
|
#64
Exceptional
10.2%
Zimbabweans
97.5
/100
|
#65
Exceptional
10.2%
Serbians
97.5
/100
|
#66
Exceptional
10.2%
Immigrants | Netherlands
97.3
/100
|
#67
Exceptional
10.2%
Immigrants | Sri Lanka
97.2
/100
|
#68
Exceptional
10.2%
Immigrants | Australia
97.1
/100
|
#69
Exceptional
10.2%
Paraguayans
97.1
/100
|
#70
Exceptional
10.2%
Europeans
97.1
/100
|
#71
Exceptional
10.2%
Immigrants | Canada
97.1
/100
|
#72
Exceptional
10.2%
Immigrants | Asia
97.0
/100
|
#73
Exceptional
10.2%
Immigrants | Eastern Europe
96.9
/100
|
#74
Exceptional
10.2%
Carpatho Rusyns
96.9
/100
|
#75
Exceptional
10.2%
Dutch
96.9
/100
|
#76
Exceptional
10.2%
Immigrants | Belgium
96.8
/100
|
#77
Exceptional
10.3%