Immigrants from Grenada vs Latvian Median Female Earnings
COMPARE
Immigrants from Grenada
Latvian
Median Female Earnings
Median Female Earnings Comparison
Immigrants from Grenada
Latvians
$41,932
MEDIAN FEMALE EARNINGS
99.0/ 100
METRIC RATING
93rd/ 347
METRIC RANK
$43,941
MEDIAN FEMALE EARNINGS
100.0/ 100
METRIC RATING
38th/ 347
METRIC RANK
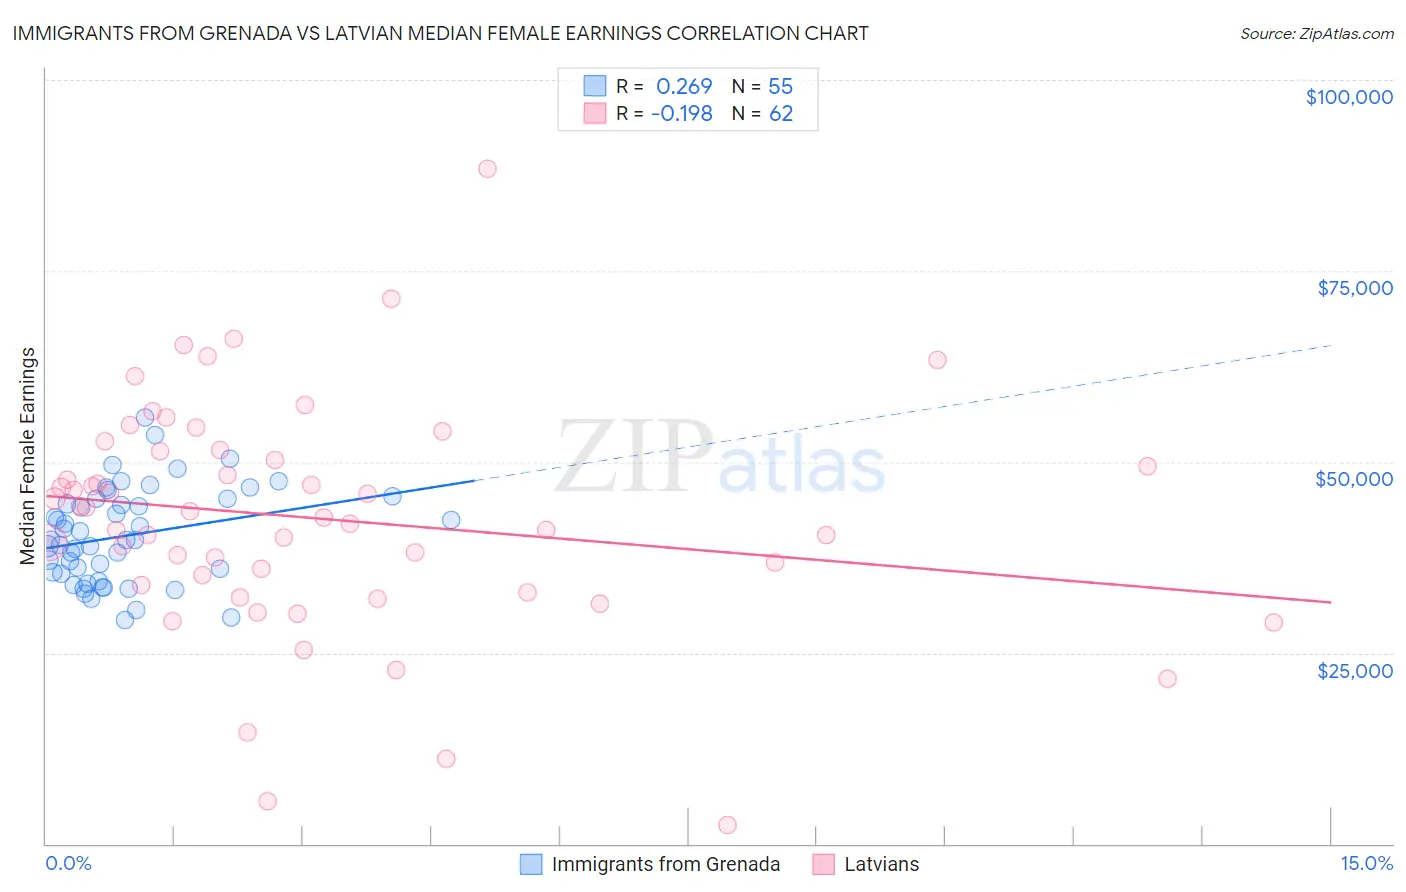
Immigrants from Grenada vs Latvian Median Female Earnings Correlation Chart
The statistical analysis conducted on geographies consisting of 67,190,904 people shows a weak positive correlation between the proportion of Immigrants from Grenada and median female earnings in the United States with a correlation coefficient (R) of 0.269 and weighted average of $41,932. Similarly, the statistical analysis conducted on geographies consisting of 220,706,355 people shows a poor negative correlation between the proportion of Latvians and median female earnings in the United States with a correlation coefficient (R) of -0.198 and weighted average of $43,941, a difference of 4.8%.
Median Female Earnings Correlation Summary
| Measurement | Immigrants from Grenada | Latvian |
| Minimum | $29,237 | $2,499 |
| Maximum | $55,809 | $88,365 |
| Range | $26,572 | $85,866 |
| Mean | $40,324 | $42,555 |
| Median | $39,773 | $43,118 |
| Interquartile 25% (IQ1) | $35,346 | $33,868 |
| Interquartile 75% (IQ3) | $45,180 | $51,451 |
| Interquartile Range (IQR) | $9,834 | $17,583 |
| Standard Deviation (Sample) | $6,162 | $15,211 |
| Standard Deviation (Population) | $6,105 | $15,087 |
Similar Demographics by Median Female Earnings
Demographics Similar to Immigrants from Grenada by Median Female Earnings
In terms of median female earnings, the demographic groups most similar to Immigrants from Grenada are Argentinean ($41,952, a difference of 0.050%), Immigrants from Western Europe ($41,990, a difference of 0.14%), Moroccan ($41,872, a difference of 0.14%), Immigrants from Netherlands ($41,870, a difference of 0.15%), and Ukrainian ($42,015, a difference of 0.20%).
| Demographics | Rating | Rank | Median Female Earnings |
| Immigrants | St. Vincent and the Grenadines | 99.3 /100 | #86 | Exceptional $42,108 |
| Lithuanians | 99.3 /100 | #87 | Exceptional $42,108 |
| Immigrants | Northern Africa | 99.3 /100 | #88 | Exceptional $42,084 |
| Immigrants | Afghanistan | 99.3 /100 | #89 | Exceptional $42,055 |
| Ukrainians | 99.2 /100 | #90 | Exceptional $42,015 |
| Immigrants | Western Europe | 99.2 /100 | #91 | Exceptional $41,990 |
| Argentineans | 99.1 /100 | #92 | Exceptional $41,952 |
| Immigrants | Grenada | 99.0 /100 | #93 | Exceptional $41,932 |
| Moroccans | 98.9 /100 | #94 | Exceptional $41,872 |
| Immigrants | Netherlands | 98.9 /100 | #95 | Exceptional $41,870 |
| South Africans | 98.8 /100 | #96 | Exceptional $41,825 |
| Immigrants | Hungary | 98.8 /100 | #97 | Exceptional $41,820 |
| Immigrants | Scotland | 98.7 /100 | #98 | Exceptional $41,771 |
| Immigrants | Barbados | 98.4 /100 | #99 | Exceptional $41,685 |
| Romanians | 98.3 /100 | #100 | Exceptional $41,663 |
Demographics Similar to Latvians by Median Female Earnings
In terms of median female earnings, the demographic groups most similar to Latvians are Immigrants from Switzerland ($43,996, a difference of 0.12%), Israeli ($43,852, a difference of 0.20%), Immigrants from Malaysia ($43,835, a difference of 0.24%), Immigrants from Turkey ($44,066, a difference of 0.28%), and Immigrants from Sri Lanka ($44,161, a difference of 0.50%).
| Demographics | Rating | Rank | Median Female Earnings |
| Immigrants | France | 100.0 /100 | #31 | Exceptional $44,541 |
| Immigrants | Northern Europe | 100.0 /100 | #32 | Exceptional $44,366 |
| Immigrants | Asia | 100.0 /100 | #33 | Exceptional $44,198 |
| Russians | 100.0 /100 | #34 | Exceptional $44,169 |
| Immigrants | Sri Lanka | 100.0 /100 | #35 | Exceptional $44,161 |
| Immigrants | Turkey | 100.0 /100 | #36 | Exceptional $44,066 |
| Immigrants | Switzerland | 100.0 /100 | #37 | Exceptional $43,996 |
| Latvians | 100.0 /100 | #38 | Exceptional $43,941 |
| Israelis | 100.0 /100 | #39 | Exceptional $43,852 |
| Immigrants | Malaysia | 100.0 /100 | #40 | Exceptional $43,835 |
| Bhutanese | 100.0 /100 | #41 | Exceptional $43,648 |
| Immigrants | Denmark | 100.0 /100 | #42 | Exceptional $43,646 |
| Bulgarians | 100.0 /100 | #43 | Exceptional $43,638 |
| Immigrants | Czechoslovakia | 100.0 /100 | #44 | Exceptional $43,571 |
| Immigrants | Europe | 100.0 /100 | #45 | Exceptional $43,523 |