Paraguayan vs Latvian In Labor Force | Age 30-34
COMPARE
Paraguayan
Latvian
In Labor Force | Age 30-34
In Labor Force | Age 30-34 Comparison
Paraguayans
Latvians
85.8%
IN LABOR FORCE | AGE 30-34
99.9/ 100
METRIC RATING
31st/ 347
METRIC RANK
86.0%
IN LABOR FORCE | AGE 30-34
100.0/ 100
METRIC RATING
16th/ 347
METRIC RANK
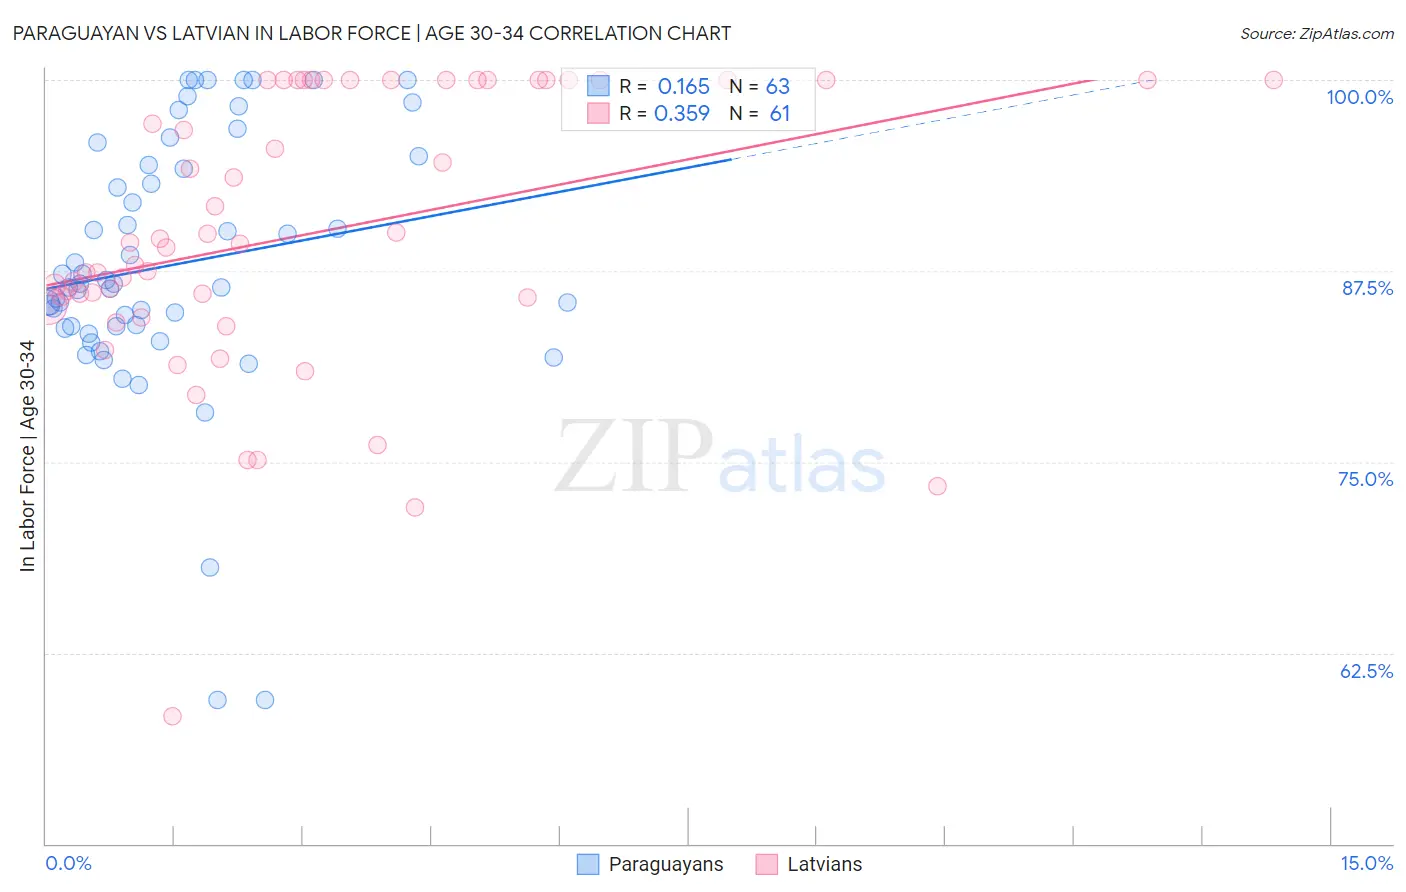
Paraguayan vs Latvian In Labor Force | Age 30-34 Correlation Chart
The statistical analysis conducted on geographies consisting of 95,107,101 people shows a poor positive correlation between the proportion of Paraguayans and labor force participation rate among population between the ages 30 and 34 in the United States with a correlation coefficient (R) of 0.165 and weighted average of 85.8%. Similarly, the statistical analysis conducted on geographies consisting of 220,645,666 people shows a mild positive correlation between the proportion of Latvians and labor force participation rate among population between the ages 30 and 34 in the United States with a correlation coefficient (R) of 0.359 and weighted average of 86.0%, a difference of 0.29%.
In Labor Force | Age 30-34 Correlation Summary
| Measurement | Paraguayan | Latvian |
| Minimum | 59.4% | 58.4% |
| Maximum | 100.0% | 100.0% |
| Range | 40.6% | 41.6% |
| Mean | 87.9% | 90.0% |
| Median | 86.6% | 89.3% |
| Interquartile 25% (IQ1) | 83.9% | 85.5% |
| Interquartile 75% (IQ3) | 94.4% | 100.0% |
| Interquartile Range (IQR) | 10.5% | 14.5% |
| Standard Deviation (Sample) | 8.6% | 9.1% |
| Standard Deviation (Population) | 8.5% | 9.1% |
Demographics Similar to Paraguayans and Latvians by In Labor Force | Age 30-34
In terms of in labor force | age 30-34, the demographic groups most similar to Paraguayans are Cypriot (85.8%, a difference of 0.0%), Immigrants from Hong Kong (85.8%, a difference of 0.020%), Tsimshian (85.8%, a difference of 0.050%), Immigrants from Bosnia and Herzegovina (85.8%, a difference of 0.050%), and Immigrants from Latvia (85.9%, a difference of 0.080%). Similarly, the demographic groups most similar to Latvians are Immigrants from Cameroon (86.0%, a difference of 0.010%), Immigrants from Albania (86.1%, a difference of 0.030%), Immigrants from Cabo Verde (86.1%, a difference of 0.040%), Immigrants from Sierra Leone (86.0%, a difference of 0.040%), and Immigrants from Croatia (86.1%, a difference of 0.060%).
| Demographics | Rating | Rank | In Labor Force | Age 30-34 |
| Immigrants | Croatia | 100.0 /100 | #13 | Exceptional 86.1% |
| Immigrants | Cabo Verde | 100.0 /100 | #14 | Exceptional 86.1% |
| Immigrants | Albania | 100.0 /100 | #15 | Exceptional 86.1% |
| Latvians | 100.0 /100 | #16 | Exceptional 86.0% |
| Immigrants | Cameroon | 100.0 /100 | #17 | Exceptional 86.0% |
| Immigrants | Sierra Leone | 100.0 /100 | #18 | Exceptional 86.0% |
| Sierra Leoneans | 100.0 /100 | #19 | Exceptional 86.0% |
| Bulgarians | 100.0 /100 | #20 | Exceptional 86.0% |
| Immigrants | Bulgaria | 100.0 /100 | #21 | Exceptional 86.0% |
| Bermudans | 100.0 /100 | #22 | Exceptional 85.9% |
| Estonians | 100.0 /100 | #23 | Exceptional 85.9% |
| Immigrants | Eritrea | 100.0 /100 | #24 | Exceptional 85.9% |
| Immigrants | North Macedonia | 100.0 /100 | #25 | Exceptional 85.9% |
| Immigrants | Eastern Africa | 100.0 /100 | #26 | Exceptional 85.9% |
| Immigrants | Liberia | 100.0 /100 | #27 | Exceptional 85.9% |
| Immigrants | Latvia | 100.0 /100 | #28 | Exceptional 85.9% |
| Tsimshian | 100.0 /100 | #29 | Exceptional 85.8% |
| Immigrants | Hong Kong | 100.0 /100 | #30 | Exceptional 85.8% |
| Paraguayans | 99.9 /100 | #31 | Exceptional 85.8% |
| Cypriots | 99.9 /100 | #32 | Exceptional 85.8% |
| Immigrants | Bosnia and Herzegovina | 99.9 /100 | #33 | Exceptional 85.8% |