Paraguayan vs Latvian Single Male Poverty
COMPARE
Paraguayan
Latvian
Single Male Poverty
Single Male Poverty Comparison
Paraguayans
Latvians
11.6%
SINGLE MALE POVERTY
99.9/ 100
METRIC RATING
51st/ 347
METRIC RANK
12.7%
SINGLE MALE POVERTY
67.9/ 100
METRIC RATING
157th/ 347
METRIC RANK
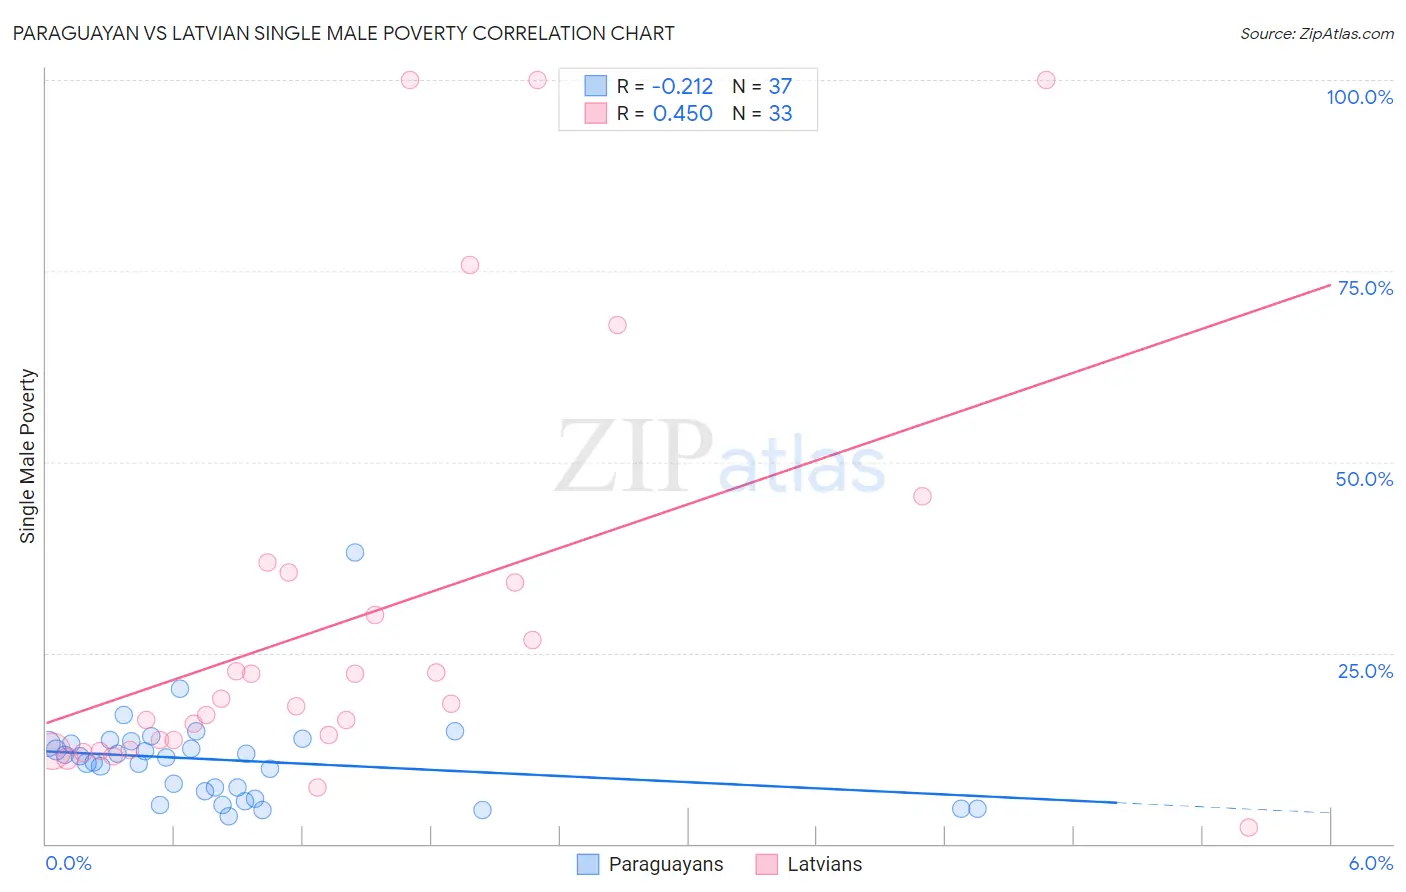
Paraguayan vs Latvian Single Male Poverty Correlation Chart
The statistical analysis conducted on geographies consisting of 90,716,103 people shows a weak negative correlation between the proportion of Paraguayans and poverty level among single males in the United States with a correlation coefficient (R) of -0.212 and weighted average of 11.6%. Similarly, the statistical analysis conducted on geographies consisting of 199,264,855 people shows a moderate positive correlation between the proportion of Latvians and poverty level among single males in the United States with a correlation coefficient (R) of 0.450 and weighted average of 12.7%, a difference of 9.1%.
Single Male Poverty Correlation Summary
| Measurement | Paraguayan | Latvian |
| Minimum | 3.6% | 2.2% |
| Maximum | 38.1% | 100.0% |
| Range | 34.5% | 97.8% |
| Mean | 10.9% | 29.8% |
| Median | 11.3% | 18.3% |
| Interquartile 25% (IQ1) | 6.4% | 13.0% |
| Interquartile 75% (IQ3) | 13.2% | 34.9% |
| Interquartile Range (IQR) | 6.8% | 21.9% |
| Standard Deviation (Sample) | 6.1% | 27.4% |
| Standard Deviation (Population) | 6.0% | 27.0% |
Similar Demographics by Single Male Poverty
Demographics Similar to Paraguayans by Single Male Poverty
In terms of single male poverty, the demographic groups most similar to Paraguayans are Immigrants from Lithuania (11.6%, a difference of 0.11%), Tlingit-Haida (11.6%, a difference of 0.17%), Immigrants from Indonesia (11.6%, a difference of 0.19%), Nepalese (11.6%, a difference of 0.26%), and Samoan (11.7%, a difference of 0.31%).
| Demographics | Rating | Rank | Single Male Poverty |
| Immigrants | Cameroon | 99.9 /100 | #44 | Exceptional 11.5% |
| Immigrants | Poland | 99.9 /100 | #45 | Exceptional 11.5% |
| Immigrants | Bulgaria | 99.9 /100 | #46 | Exceptional 11.6% |
| Nepalese | 99.9 /100 | #47 | Exceptional 11.6% |
| Immigrants | Indonesia | 99.9 /100 | #48 | Exceptional 11.6% |
| Tlingit-Haida | 99.9 /100 | #49 | Exceptional 11.6% |
| Immigrants | Lithuania | 99.9 /100 | #50 | Exceptional 11.6% |
| Paraguayans | 99.9 /100 | #51 | Exceptional 11.6% |
| Samoans | 99.9 /100 | #52 | Exceptional 11.7% |
| Bulgarians | 99.9 /100 | #53 | Exceptional 11.7% |
| Immigrants | Uzbekistan | 99.9 /100 | #54 | Exceptional 11.7% |
| Cypriots | 99.9 /100 | #55 | Exceptional 11.7% |
| Burmese | 99.8 /100 | #56 | Exceptional 11.7% |
| Immigrants | Romania | 99.8 /100 | #57 | Exceptional 11.7% |
| Immigrants | Brazil | 99.8 /100 | #58 | Exceptional 11.7% |
Demographics Similar to Latvians by Single Male Poverty
In terms of single male poverty, the demographic groups most similar to Latvians are Vietnamese (12.7%, a difference of 0.0%), Immigrants from Spain (12.7%, a difference of 0.040%), Immigrants from Scotland (12.7%, a difference of 0.060%), Immigrants (12.7%, a difference of 0.13%), and Immigrants from Middle Africa (12.7%, a difference of 0.18%).
| Demographics | Rating | Rank | Single Male Poverty |
| Immigrants | Panama | 72.1 /100 | #150 | Good 12.6% |
| Immigrants | Hungary | 71.9 /100 | #151 | Good 12.6% |
| Australians | 71.4 /100 | #152 | Good 12.6% |
| Immigrants | Immigrants | 70.1 /100 | #153 | Good 12.7% |
| Immigrants | Scotland | 68.9 /100 | #154 | Good 12.7% |
| Immigrants | Spain | 68.7 /100 | #155 | Good 12.7% |
| Vietnamese | 67.9 /100 | #156 | Good 12.7% |
| Latvians | 67.9 /100 | #157 | Good 12.7% |
| Immigrants | Middle Africa | 64.9 /100 | #158 | Good 12.7% |
| Immigrants | Liberia | 64.2 /100 | #159 | Good 12.7% |
| Greeks | 64.1 /100 | #160 | Good 12.7% |
| Immigrants | Africa | 63.4 /100 | #161 | Good 12.7% |
| Eastern Europeans | 63.3 /100 | #162 | Good 12.7% |
| Palestinians | 63.1 /100 | #163 | Good 12.7% |
| Immigrants | Nigeria | 62.8 /100 | #164 | Good 12.7% |