Paraguayan vs Latvian 4 or more Vehicles in Household
COMPARE
Paraguayan
Latvian
4 or more Vehicles in Household
4 or more Vehicles in Household Comparison
Paraguayans
Latvians
4.9%
4 OR MORE VEHICLES IN HOUSEHOLD
0.0/ 100
METRIC RATING
308th/ 347
METRIC RANK
6.1%
4 OR MORE VEHICLES IN HOUSEHOLD
21.7/ 100
METRIC RATING
200th/ 347
METRIC RANK
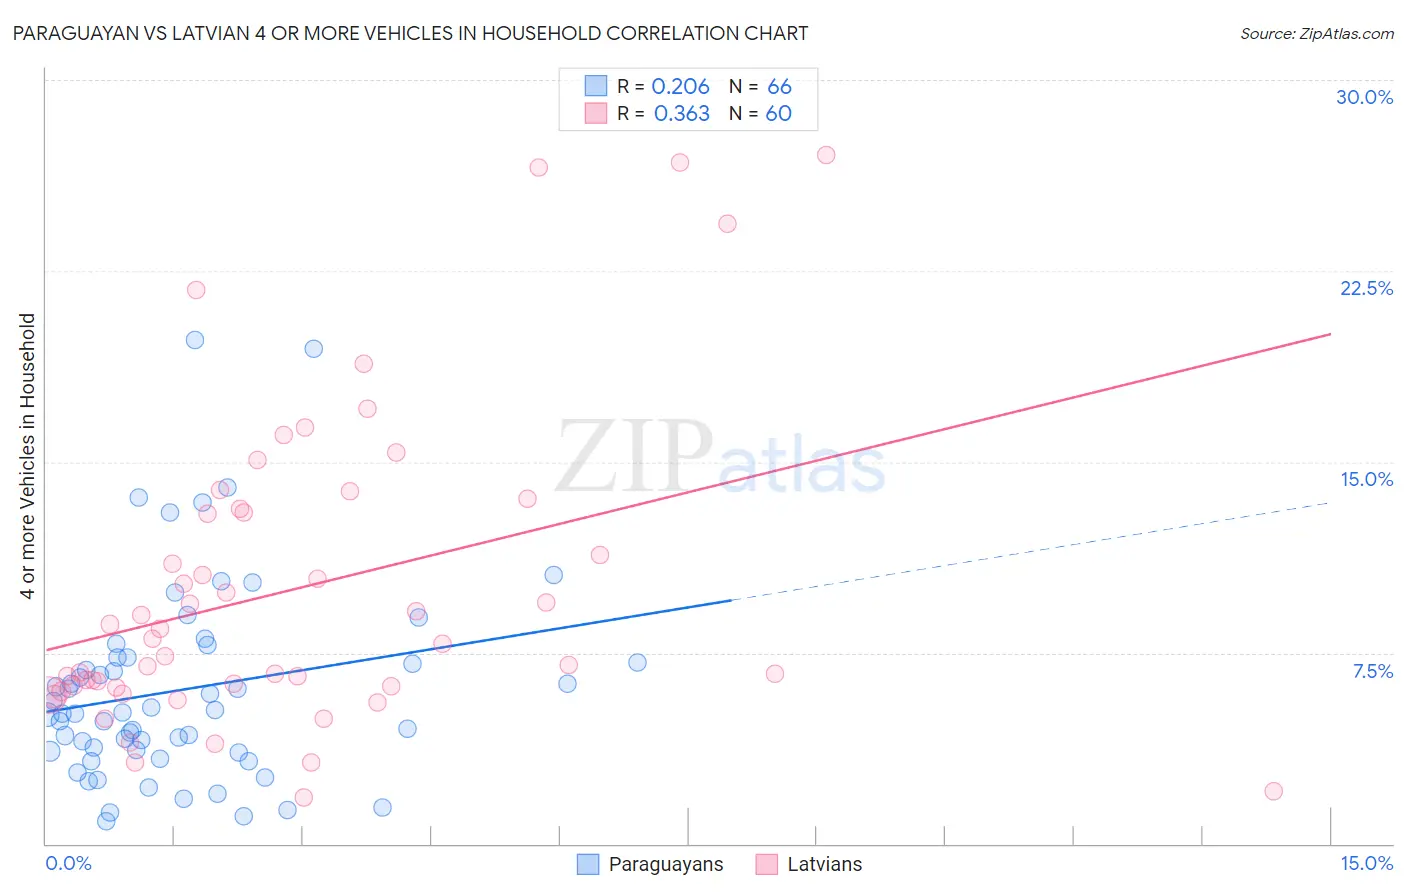
Paraguayan vs Latvian 4 or more Vehicles in Household Correlation Chart
The statistical analysis conducted on geographies consisting of 94,888,057 people shows a weak positive correlation between the proportion of Paraguayans and percentage of households with 4 or more vehicles available in the United States with a correlation coefficient (R) of 0.206 and weighted average of 4.9%. Similarly, the statistical analysis conducted on geographies consisting of 219,878,436 people shows a mild positive correlation between the proportion of Latvians and percentage of households with 4 or more vehicles available in the United States with a correlation coefficient (R) of 0.363 and weighted average of 6.1%, a difference of 23.9%.
4 or more Vehicles in Household Correlation Summary
| Measurement | Paraguayan | Latvian |
| Minimum | 0.86% | 1.8% |
| Maximum | 19.8% | 27.1% |
| Range | 18.9% | 25.3% |
| Mean | 6.1% | 10.0% |
| Median | 5.1% | 8.0% |
| Interquartile 25% (IQ1) | 3.6% | 6.2% |
| Interquartile 75% (IQ3) | 7.3% | 13.1% |
| Interquartile Range (IQR) | 3.7% | 6.9% |
| Standard Deviation (Sample) | 3.9% | 6.1% |
| Standard Deviation (Population) | 3.9% | 6.0% |
Similar Demographics by 4 or more Vehicles in Household
Demographics Similar to Paraguayans by 4 or more Vehicles in Household
In terms of 4 or more vehicles in household, the demographic groups most similar to Paraguayans are Immigrants from Somalia (4.9%, a difference of 0.15%), Moroccan (4.9%, a difference of 0.54%), Houma (4.9%, a difference of 0.54%), Menominee (5.0%, a difference of 0.72%), and Immigrants from Serbia (5.0%, a difference of 1.7%).
| Demographics | Rating | Rank | 4 or more Vehicles in Household |
| Immigrants | Zaire | 0.0 /100 | #301 | Tragic 5.1% |
| Bahamians | 0.0 /100 | #302 | Tragic 5.1% |
| Immigrants | Greece | 0.0 /100 | #303 | Tragic 5.1% |
| Cypriots | 0.0 /100 | #304 | Tragic 5.0% |
| Somalis | 0.0 /100 | #305 | Tragic 5.0% |
| Immigrants | Serbia | 0.0 /100 | #306 | Tragic 5.0% |
| Menominee | 0.0 /100 | #307 | Tragic 5.0% |
| Paraguayans | 0.0 /100 | #308 | Tragic 4.9% |
| Immigrants | Somalia | 0.0 /100 | #309 | Tragic 4.9% |
| Moroccans | 0.0 /100 | #310 | Tragic 4.9% |
| Houma | 0.0 /100 | #311 | Tragic 4.9% |
| Albanians | 0.0 /100 | #312 | Tragic 4.8% |
| Immigrants | Israel | 0.0 /100 | #313 | Tragic 4.8% |
| Immigrants | West Indies | 0.0 /100 | #314 | Tragic 4.7% |
| Immigrants | Belarus | 0.0 /100 | #315 | Tragic 4.7% |
Demographics Similar to Latvians by 4 or more Vehicles in Household
In terms of 4 or more vehicles in household, the demographic groups most similar to Latvians are Immigrants from Norway (6.1%, a difference of 0.0%), Egyptian (6.1%, a difference of 0.050%), Immigrants from South Central Asia (6.1%, a difference of 0.060%), Immigrants from Portugal (6.1%, a difference of 0.090%), and Immigrants from Sierra Leone (6.1%, a difference of 0.20%).
| Demographics | Rating | Rank | 4 or more Vehicles in Household |
| Immigrants | Kuwait | 28.0 /100 | #193 | Fair 6.2% |
| Immigrants | Sweden | 27.0 /100 | #194 | Fair 6.2% |
| Argentineans | 27.0 /100 | #195 | Fair 6.2% |
| Tsimshian | 26.4 /100 | #196 | Fair 6.2% |
| Immigrants | Sri Lanka | 23.7 /100 | #197 | Fair 6.1% |
| Immigrants | Portugal | 22.3 /100 | #198 | Fair 6.1% |
| Immigrants | Norway | 21.8 /100 | #199 | Fair 6.1% |
| Latvians | 21.7 /100 | #200 | Fair 6.1% |
| Egyptians | 21.4 /100 | #201 | Fair 6.1% |
| Immigrants | South Central Asia | 21.3 /100 | #202 | Fair 6.1% |
| Immigrants | Sierra Leone | 20.5 /100 | #203 | Fair 6.1% |
| Immigrants | Belize | 19.8 /100 | #204 | Poor 6.1% |
| Hondurans | 19.3 /100 | #205 | Poor 6.1% |
| Kenyans | 18.5 /100 | #206 | Poor 6.1% |
| Immigrants | Chile | 16.9 /100 | #207 | Poor 6.1% |