Paraguayan vs Immigrants from Micronesia Median Earnings
COMPARE
Paraguayan
Immigrants from Micronesia
Median Earnings
Median Earnings Comparison
Paraguayans
Immigrants from Micronesia
$51,068
MEDIAN EARNINGS
99.9/ 100
METRIC RATING
68th/ 347
METRIC RANK
$41,133
MEDIAN EARNINGS
0.1/ 100
METRIC RATING
298th/ 347
METRIC RANK
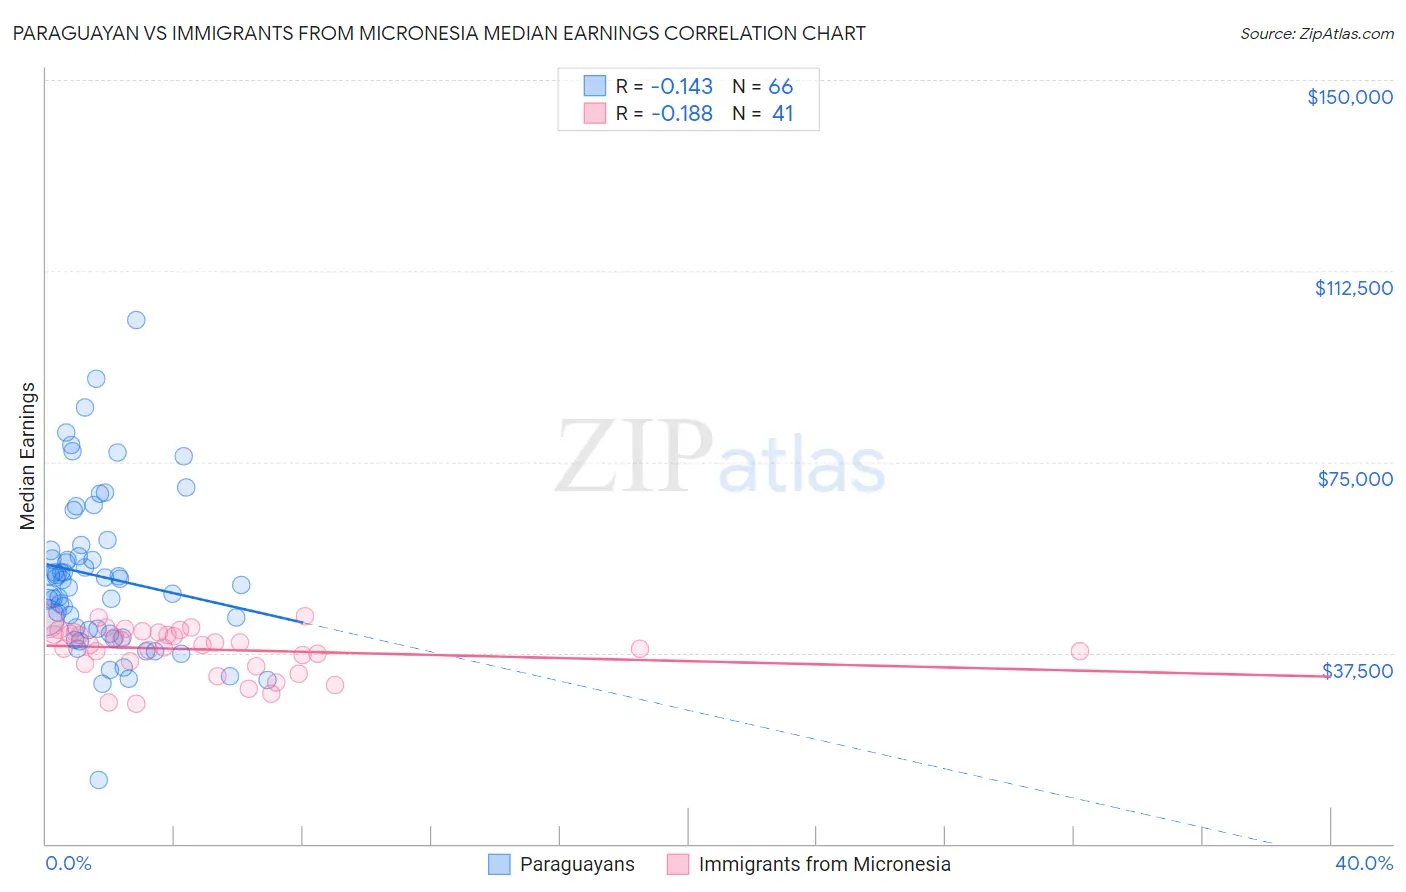
Paraguayan vs Immigrants from Micronesia Median Earnings Correlation Chart
The statistical analysis conducted on geographies consisting of 95,085,692 people shows a poor negative correlation between the proportion of Paraguayans and median earnings in the United States with a correlation coefficient (R) of -0.143 and weighted average of $51,068. Similarly, the statistical analysis conducted on geographies consisting of 61,606,741 people shows a poor negative correlation between the proportion of Immigrants from Micronesia and median earnings in the United States with a correlation coefficient (R) of -0.188 and weighted average of $41,133, a difference of 24.1%.
Median Earnings Correlation Summary
| Measurement | Paraguayan | Immigrants from Micronesia |
| Minimum | $12,403 | $27,399 |
| Maximum | $102,750 | $44,575 |
| Range | $90,347 | $17,176 |
| Mean | $52,505 | $38,171 |
| Median | $51,405 | $39,090 |
| Interquartile 25% (IQ1) | $42,088 | $35,550 |
| Interquartile 75% (IQ3) | $57,643 | $41,519 |
| Interquartile Range (IQR) | $15,555 | $5,969 |
| Standard Deviation (Sample) | $15,766 | $4,508 |
| Standard Deviation (Population) | $15,646 | $4,452 |
Similar Demographics by Median Earnings
Demographics Similar to Paraguayans by Median Earnings
In terms of median earnings, the demographic groups most similar to Paraguayans are Immigrants from Spain ($51,092, a difference of 0.050%), Mongolian ($51,038, a difference of 0.060%), Afghan ($51,112, a difference of 0.090%), Lithuanian ($50,991, a difference of 0.15%), and Immigrants from Ukraine ($50,984, a difference of 0.16%).
| Demographics | Rating | Rank | Median Earnings |
| Immigrants | Latvia | 99.9 /100 | #61 | Exceptional $51,555 |
| Immigrants | Romania | 99.9 /100 | #62 | Exceptional $51,337 |
| Immigrants | Bulgaria | 99.9 /100 | #63 | Exceptional $51,318 |
| New Zealanders | 99.9 /100 | #64 | Exceptional $51,246 |
| Greeks | 99.9 /100 | #65 | Exceptional $51,164 |
| Afghans | 99.9 /100 | #66 | Exceptional $51,112 |
| Immigrants | Spain | 99.9 /100 | #67 | Exceptional $51,092 |
| Paraguayans | 99.9 /100 | #68 | Exceptional $51,068 |
| Mongolians | 99.8 /100 | #69 | Exceptional $51,038 |
| Lithuanians | 99.8 /100 | #70 | Exceptional $50,991 |
| Immigrants | Ukraine | 99.8 /100 | #71 | Exceptional $50,984 |
| Immigrants | Egypt | 99.8 /100 | #72 | Exceptional $50,901 |
| Immigrants | Netherlands | 99.8 /100 | #73 | Exceptional $50,818 |
| South Africans | 99.8 /100 | #74 | Exceptional $50,752 |
| Immigrants | Scotland | 99.8 /100 | #75 | Exceptional $50,741 |
Demographics Similar to Immigrants from Micronesia by Median Earnings
In terms of median earnings, the demographic groups most similar to Immigrants from Micronesia are Immigrants from Caribbean ($41,119, a difference of 0.030%), Guatemalan ($41,205, a difference of 0.17%), Ute ($41,051, a difference of 0.20%), Immigrants from Latin America ($41,049, a difference of 0.20%), and Cherokee ($41,252, a difference of 0.29%).
| Demographics | Rating | Rank | Median Earnings |
| Central American Indians | 0.1 /100 | #291 | Tragic $41,474 |
| U.S. Virgin Islanders | 0.1 /100 | #292 | Tragic $41,448 |
| Immigrants | Zaire | 0.1 /100 | #293 | Tragic $41,325 |
| Potawatomi | 0.1 /100 | #294 | Tragic $41,288 |
| Bangladeshis | 0.1 /100 | #295 | Tragic $41,263 |
| Cherokee | 0.1 /100 | #296 | Tragic $41,252 |
| Guatemalans | 0.1 /100 | #297 | Tragic $41,205 |
| Immigrants | Micronesia | 0.1 /100 | #298 | Tragic $41,133 |
| Immigrants | Caribbean | 0.1 /100 | #299 | Tragic $41,119 |
| Ute | 0.1 /100 | #300 | Tragic $41,051 |
| Immigrants | Latin America | 0.1 /100 | #301 | Tragic $41,049 |
| Shoshone | 0.0 /100 | #302 | Tragic $40,932 |
| Haitians | 0.0 /100 | #303 | Tragic $40,918 |
| Immigrants | Guatemala | 0.0 /100 | #304 | Tragic $40,851 |
| Chickasaw | 0.0 /100 | #305 | Tragic $40,672 |