Paraguayan vs Immigrants from Micronesia Nursery School
COMPARE
Paraguayan
Immigrants from Micronesia
Nursery School
Nursery School Comparison
Paraguayans
Immigrants from Micronesia
97.9%
NURSERY SCHOOL
27.4/ 100
METRIC RATING
193rd/ 347
METRIC RANK
98.0%
NURSERY SCHOOL
55.0/ 100
METRIC RATING
168th/ 347
METRIC RANK
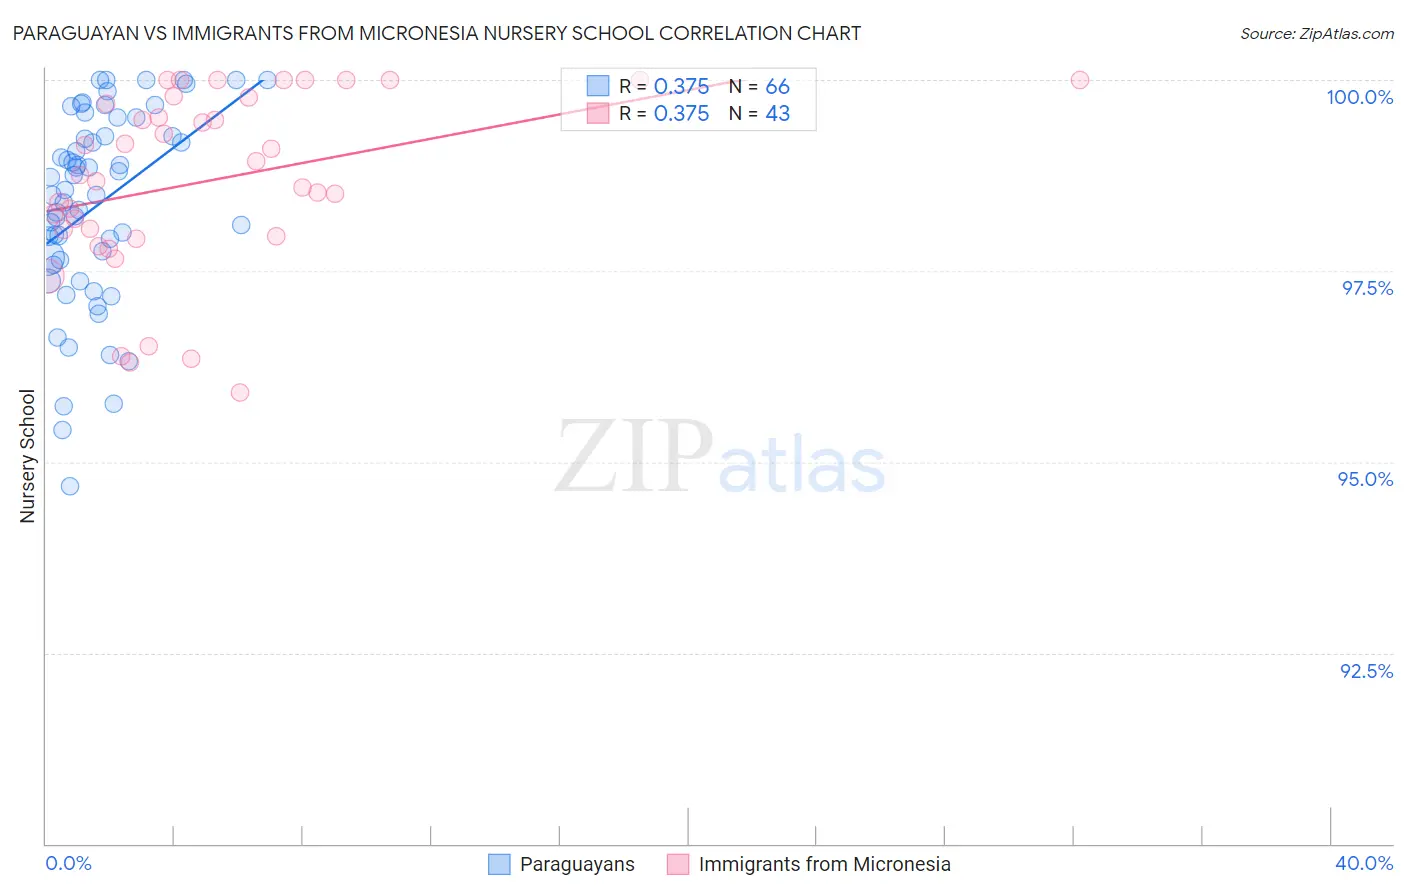
Paraguayan vs Immigrants from Micronesia Nursery School Correlation Chart
The statistical analysis conducted on geographies consisting of 95,114,254 people shows a mild positive correlation between the proportion of Paraguayans and percentage of population with at least nursery school education in the United States with a correlation coefficient (R) of 0.375 and weighted average of 97.9%. Similarly, the statistical analysis conducted on geographies consisting of 61,604,657 people shows a mild positive correlation between the proportion of Immigrants from Micronesia and percentage of population with at least nursery school education in the United States with a correlation coefficient (R) of 0.375 and weighted average of 98.0%, a difference of 0.090%.
Nursery School Correlation Summary
| Measurement | Paraguayan | Immigrants from Micronesia |
| Minimum | 94.7% | 95.9% |
| Maximum | 100.0% | 100.0% |
| Range | 5.3% | 4.1% |
| Mean | 98.4% | 98.7% |
| Median | 98.5% | 98.8% |
| Interquartile 25% (IQ1) | 97.6% | 98.0% |
| Interquartile 75% (IQ3) | 99.3% | 99.8% |
| Interquartile Range (IQR) | 1.6% | 1.8% |
| Standard Deviation (Sample) | 1.3% | 1.2% |
| Standard Deviation (Population) | 1.3% | 1.2% |
Similar Demographics by Nursery School
Demographics Similar to Paraguayans by Nursery School
In terms of nursery school, the demographic groups most similar to Paraguayans are Mongolian (97.9%, a difference of 0.0%), Hawaiian (97.9%, a difference of 0.0%), Immigrants from Taiwan (97.9%, a difference of 0.010%), Black/African American (97.9%, a difference of 0.010%), and Guamanian/Chamorro (97.9%, a difference of 0.010%).
| Demographics | Rating | Rank | Nursery School |
| Immigrants | Argentina | 40.8 /100 | #186 | Average 98.0% |
| Immigrants | Kazakhstan | 37.1 /100 | #187 | Fair 97.9% |
| Arabs | 34.7 /100 | #188 | Fair 97.9% |
| Pakistanis | 34.6 /100 | #189 | Fair 97.9% |
| Panamanians | 34.3 /100 | #190 | Fair 97.9% |
| Immigrants | Taiwan | 30.6 /100 | #191 | Fair 97.9% |
| Blacks/African Americans | 29.4 /100 | #192 | Fair 97.9% |
| Paraguayans | 27.4 /100 | #193 | Fair 97.9% |
| Mongolians | 27.3 /100 | #194 | Fair 97.9% |
| Hawaiians | 27.2 /100 | #195 | Fair 97.9% |
| Guamanians/Chamorros | 25.7 /100 | #196 | Fair 97.9% |
| Yuman | 25.7 /100 | #197 | Fair 97.9% |
| Immigrants | Kenya | 24.1 /100 | #198 | Fair 97.9% |
| Immigrants | Egypt | 22.5 /100 | #199 | Fair 97.9% |
| Tohono O'odham | 22.2 /100 | #200 | Fair 97.9% |
Demographics Similar to Immigrants from Micronesia by Nursery School
In terms of nursery school, the demographic groups most similar to Immigrants from Micronesia are Ugandan (98.0%, a difference of 0.0%), Chilean (98.0%, a difference of 0.0%), Spanish American (98.0%, a difference of 0.0%), Immigrants from Spain (98.0%, a difference of 0.0%), and Immigrants from Korea (98.0%, a difference of 0.0%).
| Demographics | Rating | Rank | Nursery School |
| Immigrants | Eastern Europe | 59.7 /100 | #161 | Average 98.0% |
| Brazilians | 59.4 /100 | #162 | Average 98.0% |
| Immigrants | Italy | 59.0 /100 | #163 | Average 98.0% |
| Ugandans | 56.4 /100 | #164 | Average 98.0% |
| Chileans | 56.4 /100 | #165 | Average 98.0% |
| Spanish Americans | 55.6 /100 | #166 | Average 98.0% |
| Immigrants | Spain | 55.6 /100 | #167 | Average 98.0% |
| Immigrants | Micronesia | 55.0 /100 | #168 | Average 98.0% |
| Immigrants | Korea | 53.8 /100 | #169 | Average 98.0% |
| Bermudans | 53.7 /100 | #170 | Average 98.0% |
| Immigrants | Jordan | 53.4 /100 | #171 | Average 98.0% |
| Immigrants | Brazil | 51.3 /100 | #172 | Average 98.0% |
| Kenyans | 50.2 /100 | #173 | Average 98.0% |
| Navajo | 50.0 /100 | #174 | Average 98.0% |
| Immigrants | Sri Lanka | 49.9 /100 | #175 | Average 98.0% |