Paraguayan vs Italian Median Earnings
COMPARE
Paraguayan
Italian
Median Earnings
Median Earnings Comparison
Paraguayans
Italians
$51,068
MEDIAN EARNINGS
99.9/ 100
METRIC RATING
68th/ 347
METRIC RANK
$49,915
MEDIAN EARNINGS
99.3/ 100
METRIC RATING
90th/ 347
METRIC RANK
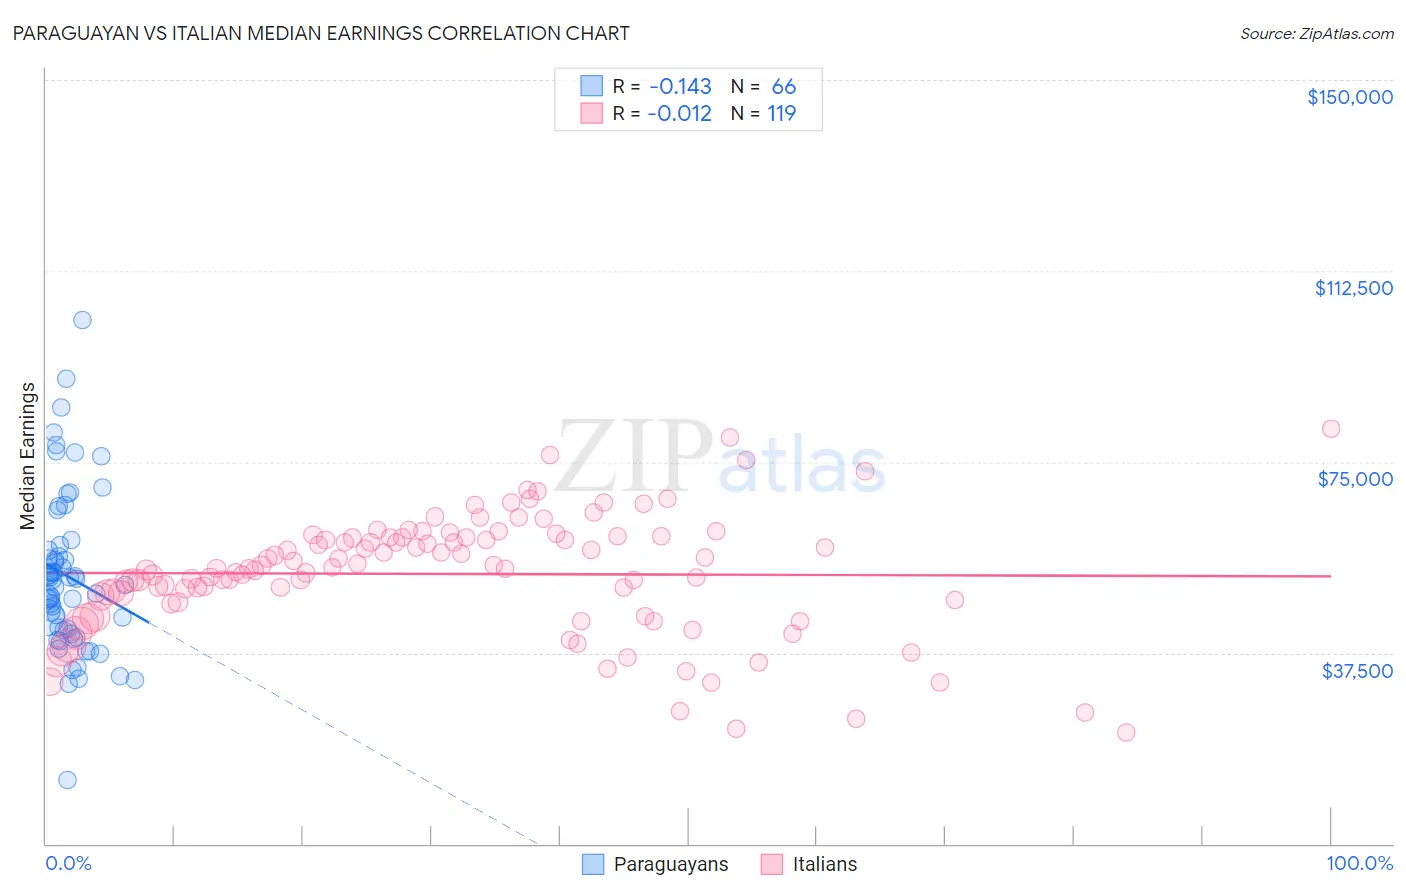
Paraguayan vs Italian Median Earnings Correlation Chart
The statistical analysis conducted on geographies consisting of 95,085,692 people shows a poor negative correlation between the proportion of Paraguayans and median earnings in the United States with a correlation coefficient (R) of -0.143 and weighted average of $51,068. Similarly, the statistical analysis conducted on geographies consisting of 574,669,176 people shows no correlation between the proportion of Italians and median earnings in the United States with a correlation coefficient (R) of -0.012 and weighted average of $49,915, a difference of 2.3%.
Median Earnings Correlation Summary
| Measurement | Paraguayan | Italian |
| Minimum | $12,403 | $21,728 |
| Maximum | $102,750 | $81,458 |
| Range | $90,347 | $59,730 |
| Mean | $52,505 | $52,992 |
| Median | $51,405 | $54,091 |
| Interquartile 25% (IQ1) | $42,088 | $47,401 |
| Interquartile 75% (IQ3) | $57,643 | $60,200 |
| Interquartile Range (IQR) | $15,555 | $12,799 |
| Standard Deviation (Sample) | $15,766 | $11,690 |
| Standard Deviation (Population) | $15,646 | $11,640 |
Similar Demographics by Median Earnings
Demographics Similar to Paraguayans by Median Earnings
In terms of median earnings, the demographic groups most similar to Paraguayans are Immigrants from Spain ($51,092, a difference of 0.050%), Mongolian ($51,038, a difference of 0.060%), Afghan ($51,112, a difference of 0.090%), Lithuanian ($50,991, a difference of 0.15%), and Immigrants from Ukraine ($50,984, a difference of 0.16%).
| Demographics | Rating | Rank | Median Earnings |
| Immigrants | Latvia | 99.9 /100 | #61 | Exceptional $51,555 |
| Immigrants | Romania | 99.9 /100 | #62 | Exceptional $51,337 |
| Immigrants | Bulgaria | 99.9 /100 | #63 | Exceptional $51,318 |
| New Zealanders | 99.9 /100 | #64 | Exceptional $51,246 |
| Greeks | 99.9 /100 | #65 | Exceptional $51,164 |
| Afghans | 99.9 /100 | #66 | Exceptional $51,112 |
| Immigrants | Spain | 99.9 /100 | #67 | Exceptional $51,092 |
| Paraguayans | 99.9 /100 | #68 | Exceptional $51,068 |
| Mongolians | 99.8 /100 | #69 | Exceptional $51,038 |
| Lithuanians | 99.8 /100 | #70 | Exceptional $50,991 |
| Immigrants | Ukraine | 99.8 /100 | #71 | Exceptional $50,984 |
| Immigrants | Egypt | 99.8 /100 | #72 | Exceptional $50,901 |
| Immigrants | Netherlands | 99.8 /100 | #73 | Exceptional $50,818 |
| South Africans | 99.8 /100 | #74 | Exceptional $50,752 |
| Immigrants | Scotland | 99.8 /100 | #75 | Exceptional $50,741 |
Demographics Similar to Italians by Median Earnings
In terms of median earnings, the demographic groups most similar to Italians are Macedonian ($49,893, a difference of 0.040%), Immigrants from Argentina ($49,841, a difference of 0.15%), Armenian ($49,804, a difference of 0.22%), Croatian ($49,724, a difference of 0.38%), and Immigrants from North America ($50,108, a difference of 0.39%).
| Demographics | Rating | Rank | Median Earnings |
| Romanians | 99.5 /100 | #83 | Exceptional $50,244 |
| Immigrants | Hungary | 99.5 /100 | #84 | Exceptional $50,227 |
| Immigrants | Kazakhstan | 99.5 /100 | #85 | Exceptional $50,225 |
| Immigrants | Canada | 99.5 /100 | #86 | Exceptional $50,192 |
| Immigrants | Uzbekistan | 99.5 /100 | #87 | Exceptional $50,151 |
| Albanians | 99.4 /100 | #88 | Exceptional $50,116 |
| Immigrants | North America | 99.4 /100 | #89 | Exceptional $50,108 |
| Italians | 99.3 /100 | #90 | Exceptional $49,915 |
| Macedonians | 99.2 /100 | #91 | Exceptional $49,893 |
| Immigrants | Argentina | 99.2 /100 | #92 | Exceptional $49,841 |
| Armenians | 99.1 /100 | #93 | Exceptional $49,804 |
| Croatians | 99.0 /100 | #94 | Exceptional $49,724 |
| Immigrants | England | 99.0 /100 | #95 | Exceptional $49,722 |
| Immigrants | Lebanon | 99.0 /100 | #96 | Exceptional $49,682 |
| Immigrants | North Macedonia | 98.9 /100 | #97 | Exceptional $49,658 |