Spanish vs Immigrants from Micronesia Median Earnings
COMPARE
Spanish
Immigrants from Micronesia
Median Earnings
Median Earnings Comparison
Spanish
Immigrants from Micronesia
$45,432
MEDIAN EARNINGS
19.7/ 100
METRIC RATING
218th/ 347
METRIC RANK
$41,133
MEDIAN EARNINGS
0.1/ 100
METRIC RATING
298th/ 347
METRIC RANK
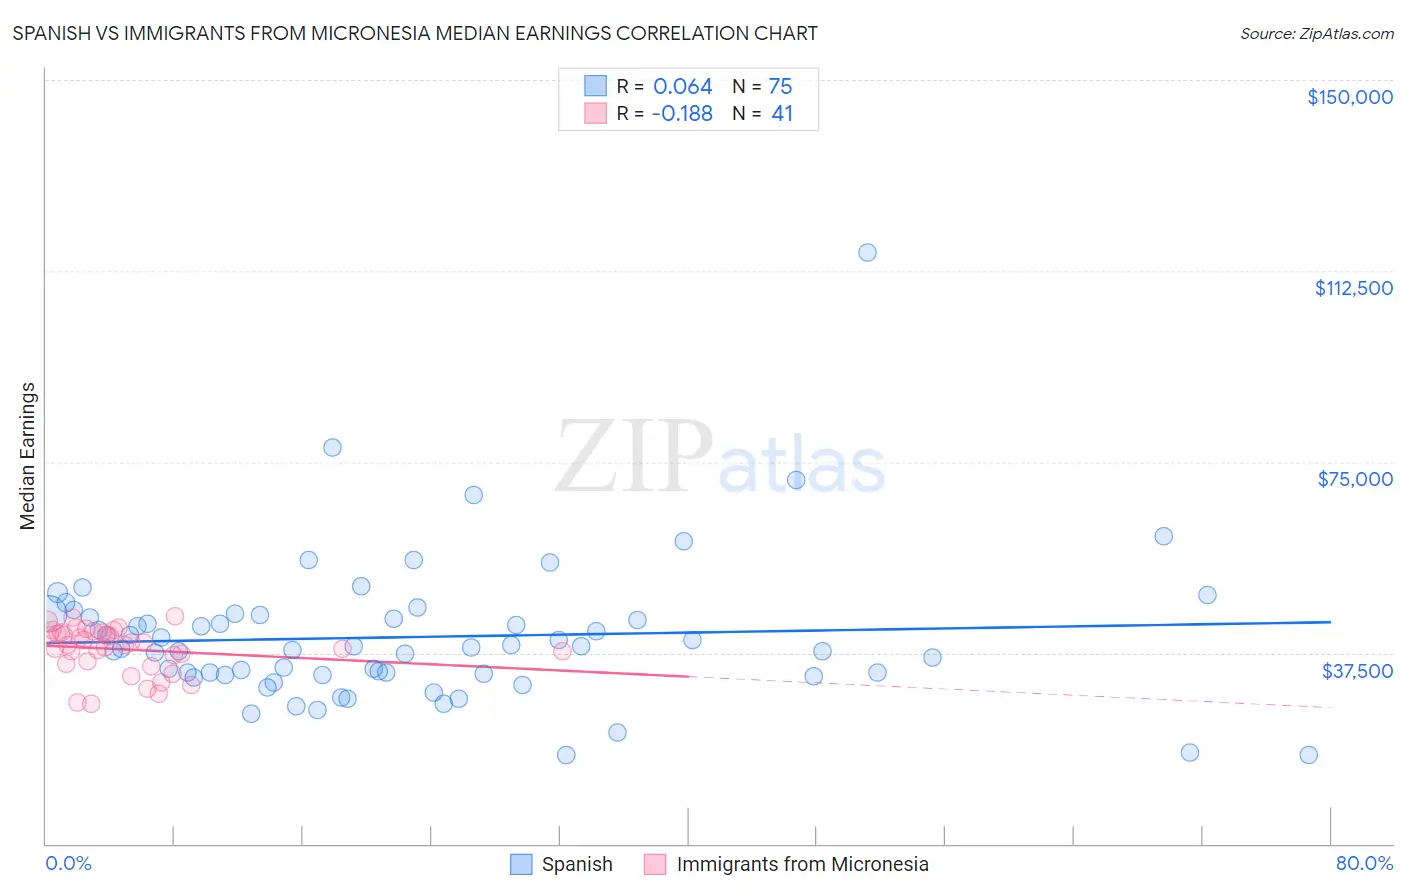
Spanish vs Immigrants from Micronesia Median Earnings Correlation Chart
The statistical analysis conducted on geographies consisting of 422,139,772 people shows a slight positive correlation between the proportion of Spanish and median earnings in the United States with a correlation coefficient (R) of 0.064 and weighted average of $45,432. Similarly, the statistical analysis conducted on geographies consisting of 61,606,741 people shows a poor negative correlation between the proportion of Immigrants from Micronesia and median earnings in the United States with a correlation coefficient (R) of -0.188 and weighted average of $41,133, a difference of 10.4%.
Median Earnings Correlation Summary
| Measurement | Spanish | Immigrants from Micronesia |
| Minimum | $17,367 | $27,399 |
| Maximum | $116,081 | $44,575 |
| Range | $98,714 | $17,176 |
| Mean | $40,595 | $38,171 |
| Median | $38,434 | $39,090 |
| Interquartile 25% (IQ1) | $33,070 | $35,550 |
| Interquartile 75% (IQ3) | $44,875 | $41,519 |
| Interquartile Range (IQR) | $11,804 | $5,969 |
| Standard Deviation (Sample) | $14,293 | $4,508 |
| Standard Deviation (Population) | $14,198 | $4,452 |
Similar Demographics by Median Earnings
Demographics Similar to Spanish by Median Earnings
In terms of median earnings, the demographic groups most similar to Spanish are Guyanese ($45,470, a difference of 0.080%), Tlingit-Haida ($45,468, a difference of 0.080%), Dutch ($45,370, a difference of 0.14%), Nigerian ($45,532, a difference of 0.22%), and Immigrants from Bangladesh ($45,532, a difference of 0.22%).
| Demographics | Rating | Rank | Median Earnings |
| Panamanians | 23.5 /100 | #211 | Fair $45,593 |
| Bermudans | 23.5 /100 | #212 | Fair $45,593 |
| Immigrants | Colombia | 22.4 /100 | #213 | Fair $45,550 |
| Nigerians | 22.0 /100 | #214 | Fair $45,532 |
| Immigrants | Bangladesh | 22.0 /100 | #215 | Fair $45,532 |
| Guyanese | 20.6 /100 | #216 | Fair $45,470 |
| Tlingit-Haida | 20.5 /100 | #217 | Fair $45,468 |
| Spanish | 19.7 /100 | #218 | Poor $45,432 |
| Dutch | 18.4 /100 | #219 | Poor $45,370 |
| Ecuadorians | 15.3 /100 | #220 | Poor $45,214 |
| Immigrants | Guyana | 15.1 /100 | #221 | Poor $45,204 |
| Immigrants | Panama | 15.0 /100 | #222 | Poor $45,198 |
| Whites/Caucasians | 15.0 /100 | #223 | Poor $45,197 |
| West Indians | 13.9 /100 | #224 | Poor $45,132 |
| Immigrants | Cambodia | 13.2 /100 | #225 | Poor $45,090 |
Demographics Similar to Immigrants from Micronesia by Median Earnings
In terms of median earnings, the demographic groups most similar to Immigrants from Micronesia are Immigrants from Caribbean ($41,119, a difference of 0.030%), Guatemalan ($41,205, a difference of 0.17%), Ute ($41,051, a difference of 0.20%), Immigrants from Latin America ($41,049, a difference of 0.20%), and Cherokee ($41,252, a difference of 0.29%).
| Demographics | Rating | Rank | Median Earnings |
| Central American Indians | 0.1 /100 | #291 | Tragic $41,474 |
| U.S. Virgin Islanders | 0.1 /100 | #292 | Tragic $41,448 |
| Immigrants | Zaire | 0.1 /100 | #293 | Tragic $41,325 |
| Potawatomi | 0.1 /100 | #294 | Tragic $41,288 |
| Bangladeshis | 0.1 /100 | #295 | Tragic $41,263 |
| Cherokee | 0.1 /100 | #296 | Tragic $41,252 |
| Guatemalans | 0.1 /100 | #297 | Tragic $41,205 |
| Immigrants | Micronesia | 0.1 /100 | #298 | Tragic $41,133 |
| Immigrants | Caribbean | 0.1 /100 | #299 | Tragic $41,119 |
| Ute | 0.1 /100 | #300 | Tragic $41,051 |
| Immigrants | Latin America | 0.1 /100 | #301 | Tragic $41,049 |
| Shoshone | 0.0 /100 | #302 | Tragic $40,932 |
| Haitians | 0.0 /100 | #303 | Tragic $40,918 |
| Immigrants | Guatemala | 0.0 /100 | #304 | Tragic $40,851 |
| Chickasaw | 0.0 /100 | #305 | Tragic $40,672 |