Paraguayan vs Immigrants from Micronesia 3rd Grade
COMPARE
Paraguayan
Immigrants from Micronesia
3rd Grade
3rd Grade Comparison
Paraguayans
Immigrants from Micronesia
97.7%
3RD GRADE
26.2/ 100
METRIC RATING
196th/ 347
METRIC RANK
97.8%
3RD GRADE
47.6/ 100
METRIC RATING
175th/ 347
METRIC RANK
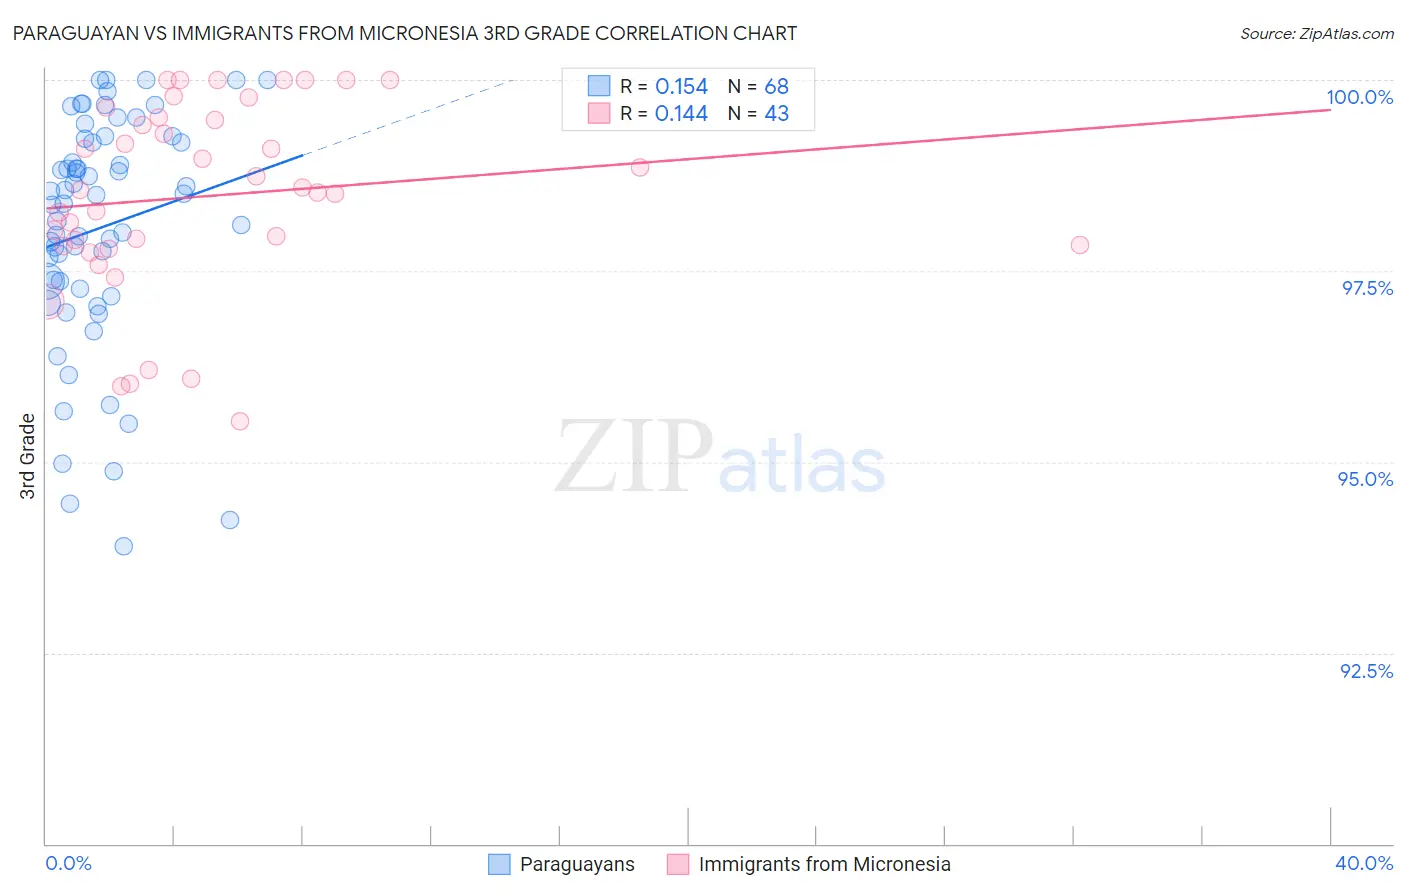
Paraguayan vs Immigrants from Micronesia 3rd Grade Correlation Chart
The statistical analysis conducted on geographies consisting of 95,115,093 people shows a poor positive correlation between the proportion of Paraguayans and percentage of population with at least 3rd grade education in the United States with a correlation coefficient (R) of 0.154 and weighted average of 97.7%. Similarly, the statistical analysis conducted on geographies consisting of 61,604,657 people shows a poor positive correlation between the proportion of Immigrants from Micronesia and percentage of population with at least 3rd grade education in the United States with a correlation coefficient (R) of 0.144 and weighted average of 97.8%, a difference of 0.080%.
3rd Grade Correlation Summary
| Measurement | Paraguayan | Immigrants from Micronesia |
| Minimum | 93.9% | 95.5% |
| Maximum | 100.0% | 100.0% |
| Range | 6.1% | 4.5% |
| Mean | 98.1% | 98.5% |
| Median | 98.4% | 98.6% |
| Interquartile 25% (IQ1) | 97.3% | 97.8% |
| Interquartile 75% (IQ3) | 99.2% | 99.5% |
| Interquartile Range (IQR) | 1.9% | 1.7% |
| Standard Deviation (Sample) | 1.5% | 1.2% |
| Standard Deviation (Population) | 1.5% | 1.2% |
Similar Demographics by 3rd Grade
Demographics Similar to Paraguayans by 3rd Grade
In terms of 3rd grade, the demographic groups most similar to Paraguayans are Immigrants from Egypt (97.7%, a difference of 0.0%), Hawaiian (97.7%, a difference of 0.0%), Black/African American (97.7%, a difference of 0.010%), Mongolian (97.7%, a difference of 0.010%), and Immigrants from Kenya (97.7%, a difference of 0.010%).
| Demographics | Rating | Rank | 3rd Grade |
| Pakistanis | 34.2 /100 | #189 | Fair 97.7% |
| Panamanians | 31.5 /100 | #190 | Fair 97.7% |
| Blacks/African Americans | 29.6 /100 | #191 | Fair 97.7% |
| Mongolians | 29.1 /100 | #192 | Fair 97.7% |
| Immigrants | Kenya | 28.2 /100 | #193 | Fair 97.7% |
| Immigrants | Uganda | 27.4 /100 | #194 | Fair 97.7% |
| Immigrants | Egypt | 26.8 /100 | #195 | Fair 97.7% |
| Paraguayans | 26.2 /100 | #196 | Fair 97.7% |
| Hawaiians | 25.7 /100 | #197 | Fair 97.7% |
| Guamanians/Chamorros | 23.6 /100 | #198 | Fair 97.7% |
| Immigrants | Ukraine | 22.7 /100 | #199 | Fair 97.7% |
| Immigrants | Albania | 22.6 /100 | #200 | Fair 97.7% |
| Immigrants | Lebanon | 21.7 /100 | #201 | Fair 97.7% |
| Immigrants | Southern Europe | 17.7 /100 | #202 | Poor 97.6% |
| Paiute | 16.7 /100 | #203 | Poor 97.6% |
Demographics Similar to Immigrants from Micronesia by 3rd Grade
In terms of 3rd grade, the demographic groups most similar to Immigrants from Micronesia are Immigrants from Poland (97.8%, a difference of 0.0%), Egyptian (97.7%, a difference of 0.0%), Immigrants from Brazil (97.7%, a difference of 0.0%), Kenyan (97.8%, a difference of 0.010%), and Spanish American (97.8%, a difference of 0.010%).
| Demographics | Rating | Rank | 3rd Grade |
| Immigrants | Spain | 54.3 /100 | #168 | Average 97.8% |
| Comanche | 53.8 /100 | #169 | Average 97.8% |
| Brazilians | 53.7 /100 | #170 | Average 97.8% |
| Kenyans | 51.8 /100 | #171 | Average 97.8% |
| Spanish Americans | 51.8 /100 | #172 | Average 97.8% |
| Immigrants | Korea | 50.9 /100 | #173 | Average 97.8% |
| Navajo | 50.0 /100 | #174 | Average 97.8% |
| Immigrants | Micronesia | 47.6 /100 | #175 | Average 97.8% |
| Immigrants | Poland | 47.1 /100 | #176 | Average 97.8% |
| Egyptians | 46.6 /100 | #177 | Average 97.7% |
| Immigrants | Brazil | 46.4 /100 | #178 | Average 97.7% |
| Immigrants | Belarus | 45.9 /100 | #179 | Average 97.7% |
| Immigrants | Sri Lanka | 45.1 /100 | #180 | Average 97.7% |
| Immigrants | Venezuela | 44.4 /100 | #181 | Average 97.7% |
| Argentineans | 42.9 /100 | #182 | Average 97.7% |