Paraguayan vs Immigrants from Micronesia No Schooling Completed
COMPARE
Paraguayan
Immigrants from Micronesia
No Schooling Completed
No Schooling Completed Comparison
Paraguayans
Immigrants from Micronesia
2.2%
NO SCHOOLING COMPLETED
29.3/ 100
METRIC RATING
193rd/ 347
METRIC RANK
2.1%
NO SCHOOLING COMPLETED
50.0/ 100
METRIC RATING
174th/ 347
METRIC RANK
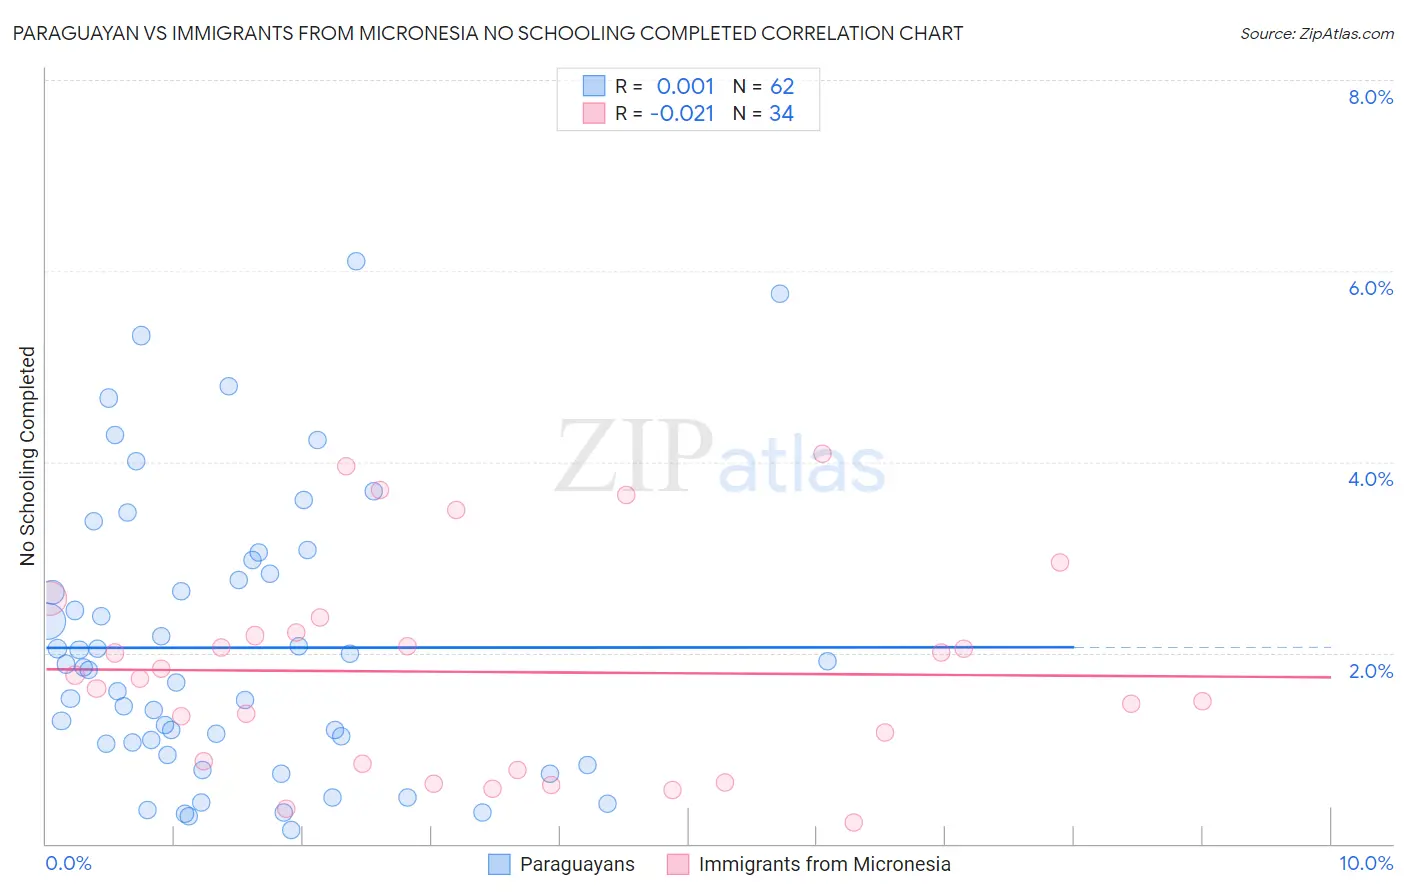
Paraguayan vs Immigrants from Micronesia No Schooling Completed Correlation Chart
The statistical analysis conducted on geographies consisting of 94,864,851 people shows no correlation between the proportion of Paraguayans and percentage of population with no schooling in the United States with a correlation coefficient (R) of 0.001 and weighted average of 2.2%. Similarly, the statistical analysis conducted on geographies consisting of 61,387,395 people shows no correlation between the proportion of Immigrants from Micronesia and percentage of population with no schooling in the United States with a correlation coefficient (R) of -0.021 and weighted average of 2.1%, a difference of 3.0%.
No Schooling Completed Correlation Summary
| Measurement | Paraguayan | Immigrants from Micronesia |
| Minimum | 0.14% | 0.23% |
| Maximum | 6.1% | 4.1% |
| Range | 6.0% | 3.9% |
| Mean | 2.1% | 1.8% |
| Median | 1.8% | 1.7% |
| Interquartile 25% (IQ1) | 1.0% | 0.84% |
| Interquartile 75% (IQ3) | 2.8% | 2.2% |
| Interquartile Range (IQR) | 1.8% | 1.4% |
| Standard Deviation (Sample) | 1.5% | 1.1% |
| Standard Deviation (Population) | 1.4% | 1.1% |
Demographics Similar to Paraguayans and Immigrants from Micronesia by No Schooling Completed
In terms of no schooling completed, the demographic groups most similar to Paraguayans are Guamanian/Chamorro (2.2%, a difference of 0.080%), Bermudan (2.1%, a difference of 0.21%), Spanish American (2.1%, a difference of 0.51%), Immigrants from Egypt (2.1%, a difference of 1.0%), and Immigrants from Kenya (2.1%, a difference of 1.0%). Similarly, the demographic groups most similar to Immigrants from Micronesia are Immigrants from Belarus (2.1%, a difference of 0.24%), Arab (2.1%, a difference of 0.48%), Panamanian (2.1%, a difference of 0.65%), Arapaho (2.1%, a difference of 0.67%), and Pakistani (2.1%, a difference of 0.71%).
| Demographics | Rating | Rank | No Schooling Completed |
| Immigrants | Belarus | 51.8 /100 | #173 | Average 2.1% |
| Immigrants | Micronesia | 50.0 /100 | #174 | Average 2.1% |
| Arabs | 46.4 /100 | #175 | Average 2.1% |
| Panamanians | 45.2 /100 | #176 | Average 2.1% |
| Arapaho | 45.0 /100 | #177 | Average 2.1% |
| Pakistanis | 44.7 /100 | #178 | Average 2.1% |
| Immigrants | Kazakhstan | 44.3 /100 | #179 | Average 2.1% |
| Portuguese | 43.9 /100 | #180 | Average 2.1% |
| Immigrants | Taiwan | 42.6 /100 | #181 | Average 2.1% |
| French American Indians | 42.2 /100 | #182 | Average 2.1% |
| Blacks/African Americans | 41.4 /100 | #183 | Average 2.1% |
| Pima | 41.3 /100 | #184 | Average 2.1% |
| Mongolians | 40.8 /100 | #185 | Average 2.1% |
| Immigrants | Bosnia and Herzegovina | 38.6 /100 | #186 | Fair 2.1% |
| Navajo | 36.5 /100 | #187 | Fair 2.1% |
| Immigrants | Kenya | 36.2 /100 | #188 | Fair 2.1% |
| Immigrants | Egypt | 36.1 /100 | #189 | Fair 2.1% |
| Spanish Americans | 32.6 /100 | #190 | Fair 2.1% |
| Bermudans | 30.7 /100 | #191 | Fair 2.1% |
| Guamanians/Chamorros | 29.8 /100 | #192 | Fair 2.2% |
| Paraguayans | 29.3 /100 | #193 | Fair 2.2% |