Haitian vs Immigrants from Micronesia Median Earnings
COMPARE
Haitian
Immigrants from Micronesia
Median Earnings
Median Earnings Comparison
Haitians
Immigrants from Micronesia
$40,918
MEDIAN EARNINGS
0.0/ 100
METRIC RATING
303rd/ 347
METRIC RANK
$41,133
MEDIAN EARNINGS
0.1/ 100
METRIC RATING
298th/ 347
METRIC RANK
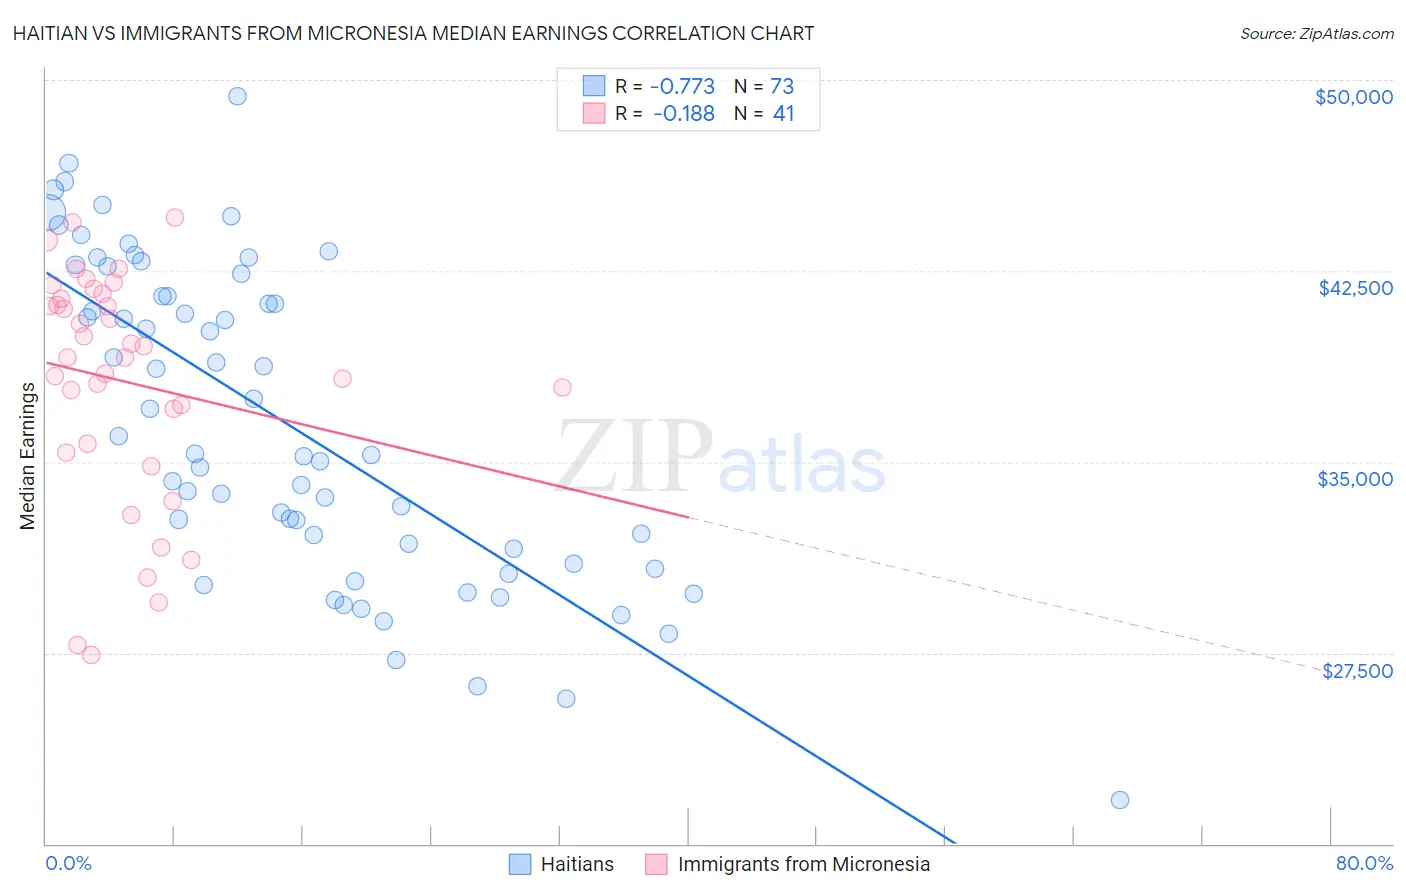
Haitian vs Immigrants from Micronesia Median Earnings Correlation Chart
The statistical analysis conducted on geographies consisting of 288,009,020 people shows a strong negative correlation between the proportion of Haitians and median earnings in the United States with a correlation coefficient (R) of -0.773 and weighted average of $40,918. Similarly, the statistical analysis conducted on geographies consisting of 61,606,741 people shows a poor negative correlation between the proportion of Immigrants from Micronesia and median earnings in the United States with a correlation coefficient (R) of -0.188 and weighted average of $41,133, a difference of 0.52%.
Median Earnings Correlation Summary
| Measurement | Haitian | Immigrants from Micronesia |
| Minimum | $21,741 | $27,399 |
| Maximum | $49,370 | $44,575 |
| Range | $27,629 | $17,176 |
| Mean | $36,539 | $38,171 |
| Median | $35,319 | $39,090 |
| Interquartile 25% (IQ1) | $31,314 | $35,550 |
| Interquartile 75% (IQ3) | $41,959 | $41,519 |
| Interquartile Range (IQR) | $10,645 | $5,969 |
| Standard Deviation (Sample) | $6,179 | $4,508 |
| Standard Deviation (Population) | $6,136 | $4,452 |
Demographics Similar to Haitians and Immigrants from Micronesia by Median Earnings
In terms of median earnings, the demographic groups most similar to Haitians are Shoshone ($40,932, a difference of 0.030%), Immigrants from Guatemala ($40,851, a difference of 0.16%), Ute ($41,051, a difference of 0.32%), Immigrants from Latin America ($41,049, a difference of 0.32%), and Immigrants from Caribbean ($41,119, a difference of 0.49%). Similarly, the demographic groups most similar to Immigrants from Micronesia are Immigrants from Caribbean ($41,119, a difference of 0.030%), Guatemalan ($41,205, a difference of 0.17%), Ute ($41,051, a difference of 0.20%), Immigrants from Latin America ($41,049, a difference of 0.20%), and Cherokee ($41,252, a difference of 0.29%).
| Demographics | Rating | Rank | Median Earnings |
| Paiute | 0.1 /100 | #290 | Tragic $41,508 |
| Central American Indians | 0.1 /100 | #291 | Tragic $41,474 |
| U.S. Virgin Islanders | 0.1 /100 | #292 | Tragic $41,448 |
| Immigrants | Zaire | 0.1 /100 | #293 | Tragic $41,325 |
| Potawatomi | 0.1 /100 | #294 | Tragic $41,288 |
| Bangladeshis | 0.1 /100 | #295 | Tragic $41,263 |
| Cherokee | 0.1 /100 | #296 | Tragic $41,252 |
| Guatemalans | 0.1 /100 | #297 | Tragic $41,205 |
| Immigrants | Micronesia | 0.1 /100 | #298 | Tragic $41,133 |
| Immigrants | Caribbean | 0.1 /100 | #299 | Tragic $41,119 |
| Ute | 0.1 /100 | #300 | Tragic $41,051 |
| Immigrants | Latin America | 0.1 /100 | #301 | Tragic $41,049 |
| Shoshone | 0.0 /100 | #302 | Tragic $40,932 |
| Haitians | 0.0 /100 | #303 | Tragic $40,918 |
| Immigrants | Guatemala | 0.0 /100 | #304 | Tragic $40,851 |
| Chickasaw | 0.0 /100 | #305 | Tragic $40,672 |
| Yaqui | 0.0 /100 | #306 | Tragic $40,647 |
| Hondurans | 0.0 /100 | #307 | Tragic $40,638 |
| Cubans | 0.0 /100 | #308 | Tragic $40,619 |
| Immigrants | Haiti | 0.0 /100 | #309 | Tragic $40,550 |
| Apache | 0.0 /100 | #310 | Tragic $40,388 |