Immigrants from Armenia vs Immigrants from Micronesia Median Earnings
COMPARE
Immigrants from Armenia
Immigrants from Micronesia
Median Earnings
Median Earnings Comparison
Immigrants from Armenia
Immigrants from Micronesia
$46,094
MEDIAN EARNINGS
38.3/ 100
METRIC RATING
188th/ 347
METRIC RANK
$41,133
MEDIAN EARNINGS
0.1/ 100
METRIC RATING
298th/ 347
METRIC RANK
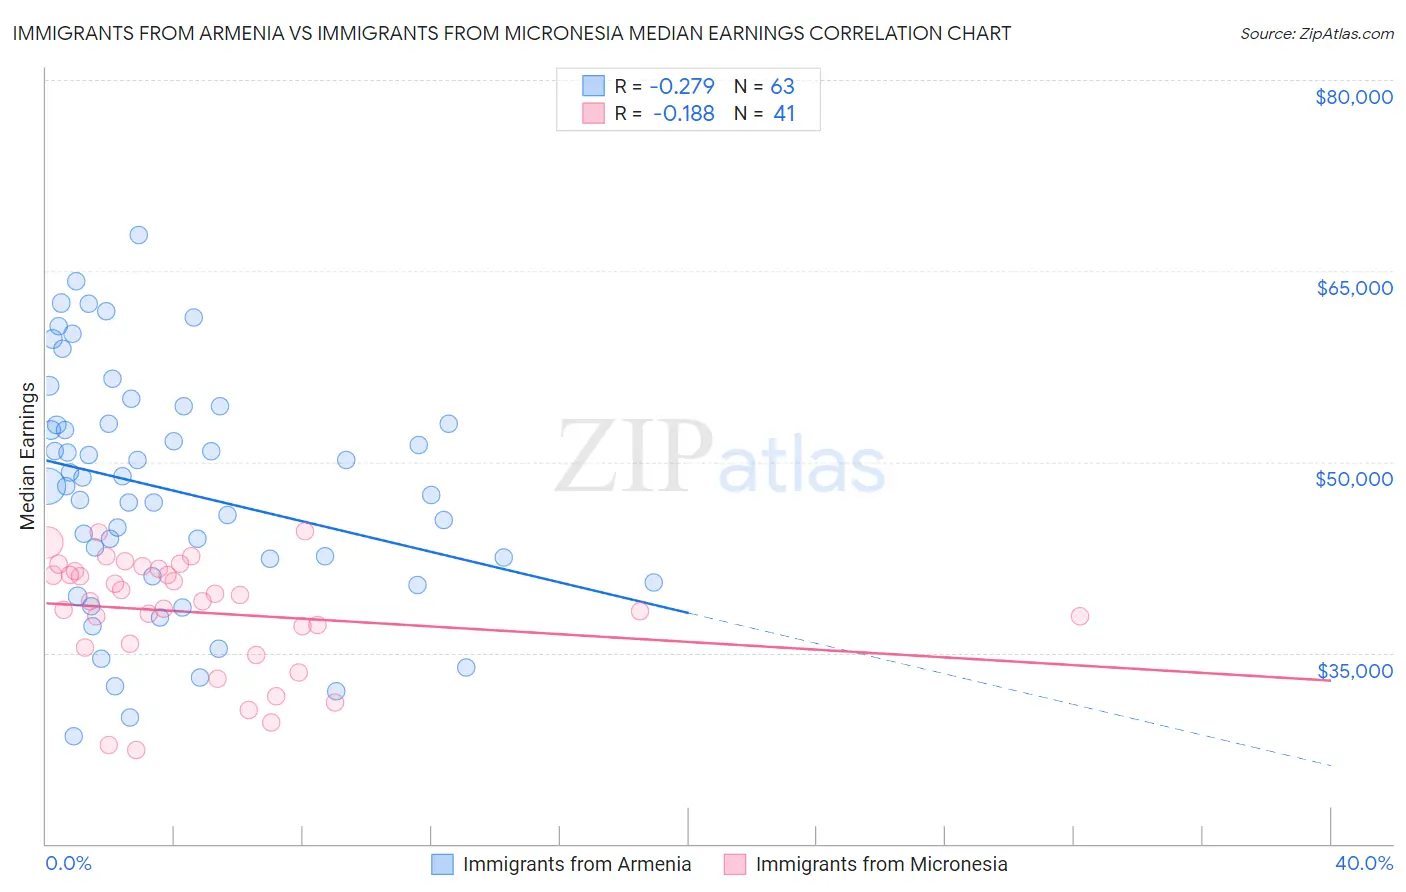
Immigrants from Armenia vs Immigrants from Micronesia Median Earnings Correlation Chart
The statistical analysis conducted on geographies consisting of 97,724,966 people shows a weak negative correlation between the proportion of Immigrants from Armenia and median earnings in the United States with a correlation coefficient (R) of -0.279 and weighted average of $46,094. Similarly, the statistical analysis conducted on geographies consisting of 61,606,741 people shows a poor negative correlation between the proportion of Immigrants from Micronesia and median earnings in the United States with a correlation coefficient (R) of -0.188 and weighted average of $41,133, a difference of 12.1%.
Median Earnings Correlation Summary
| Measurement | Immigrants from Armenia | Immigrants from Micronesia |
| Minimum | $28,479 | $27,399 |
| Maximum | $67,833 | $44,575 |
| Range | $39,354 | $17,176 |
| Mean | $47,758 | $38,171 |
| Median | $48,131 | $39,090 |
| Interquartile 25% (IQ1) | $40,972 | $35,550 |
| Interquartile 75% (IQ3) | $53,018 | $41,519 |
| Interquartile Range (IQR) | $12,046 | $5,969 |
| Standard Deviation (Sample) | $9,191 | $4,508 |
| Standard Deviation (Population) | $9,118 | $4,452 |
Similar Demographics by Median Earnings
Demographics Similar to Immigrants from Armenia by Median Earnings
In terms of median earnings, the demographic groups most similar to Immigrants from Armenia are Spaniard ($46,059, a difference of 0.080%), Iraqi ($46,140, a difference of 0.10%), French Canadian ($46,026, a difference of 0.15%), Vietnamese ($46,172, a difference of 0.17%), and Uruguayan ($46,190, a difference of 0.21%).
| Demographics | Rating | Rank | Median Earnings |
| Immigrants | Cameroon | 46.4 /100 | #181 | Average $46,329 |
| Swiss | 45.9 /100 | #182 | Average $46,315 |
| French | 45.2 /100 | #183 | Average $46,296 |
| Immigrants | Kenya | 42.4 /100 | #184 | Average $46,214 |
| Uruguayans | 41.6 /100 | #185 | Average $46,190 |
| Vietnamese | 40.9 /100 | #186 | Average $46,172 |
| Iraqis | 39.9 /100 | #187 | Fair $46,140 |
| Immigrants | Armenia | 38.3 /100 | #188 | Fair $46,094 |
| Spaniards | 37.2 /100 | #189 | Fair $46,059 |
| French Canadians | 36.1 /100 | #190 | Fair $46,026 |
| Finns | 33.4 /100 | #191 | Fair $45,940 |
| Germans | 33.2 /100 | #192 | Fair $45,935 |
| Guamanians/Chamorros | 33.2 /100 | #193 | Fair $45,933 |
| Immigrants | Costa Rica | 33.0 /100 | #194 | Fair $45,928 |
| Immigrants | St. Vincent and the Grenadines | 32.4 /100 | #195 | Fair $45,908 |
Demographics Similar to Immigrants from Micronesia by Median Earnings
In terms of median earnings, the demographic groups most similar to Immigrants from Micronesia are Immigrants from Caribbean ($41,119, a difference of 0.030%), Guatemalan ($41,205, a difference of 0.17%), Ute ($41,051, a difference of 0.20%), Immigrants from Latin America ($41,049, a difference of 0.20%), and Cherokee ($41,252, a difference of 0.29%).
| Demographics | Rating | Rank | Median Earnings |
| Central American Indians | 0.1 /100 | #291 | Tragic $41,474 |
| U.S. Virgin Islanders | 0.1 /100 | #292 | Tragic $41,448 |
| Immigrants | Zaire | 0.1 /100 | #293 | Tragic $41,325 |
| Potawatomi | 0.1 /100 | #294 | Tragic $41,288 |
| Bangladeshis | 0.1 /100 | #295 | Tragic $41,263 |
| Cherokee | 0.1 /100 | #296 | Tragic $41,252 |
| Guatemalans | 0.1 /100 | #297 | Tragic $41,205 |
| Immigrants | Micronesia | 0.1 /100 | #298 | Tragic $41,133 |
| Immigrants | Caribbean | 0.1 /100 | #299 | Tragic $41,119 |
| Ute | 0.1 /100 | #300 | Tragic $41,051 |
| Immigrants | Latin America | 0.1 /100 | #301 | Tragic $41,049 |
| Shoshone | 0.0 /100 | #302 | Tragic $40,932 |
| Haitians | 0.0 /100 | #303 | Tragic $40,918 |
| Immigrants | Guatemala | 0.0 /100 | #304 | Tragic $40,851 |
| Chickasaw | 0.0 /100 | #305 | Tragic $40,672 |