Inupiat vs Immigrants from Micronesia Median Earnings
COMPARE
Inupiat
Immigrants from Micronesia
Median Earnings
Median Earnings Comparison
Inupiat
Immigrants from Micronesia
$43,000
MEDIAN EARNINGS
0.8/ 100
METRIC RATING
263rd/ 347
METRIC RANK
$41,133
MEDIAN EARNINGS
0.1/ 100
METRIC RATING
298th/ 347
METRIC RANK
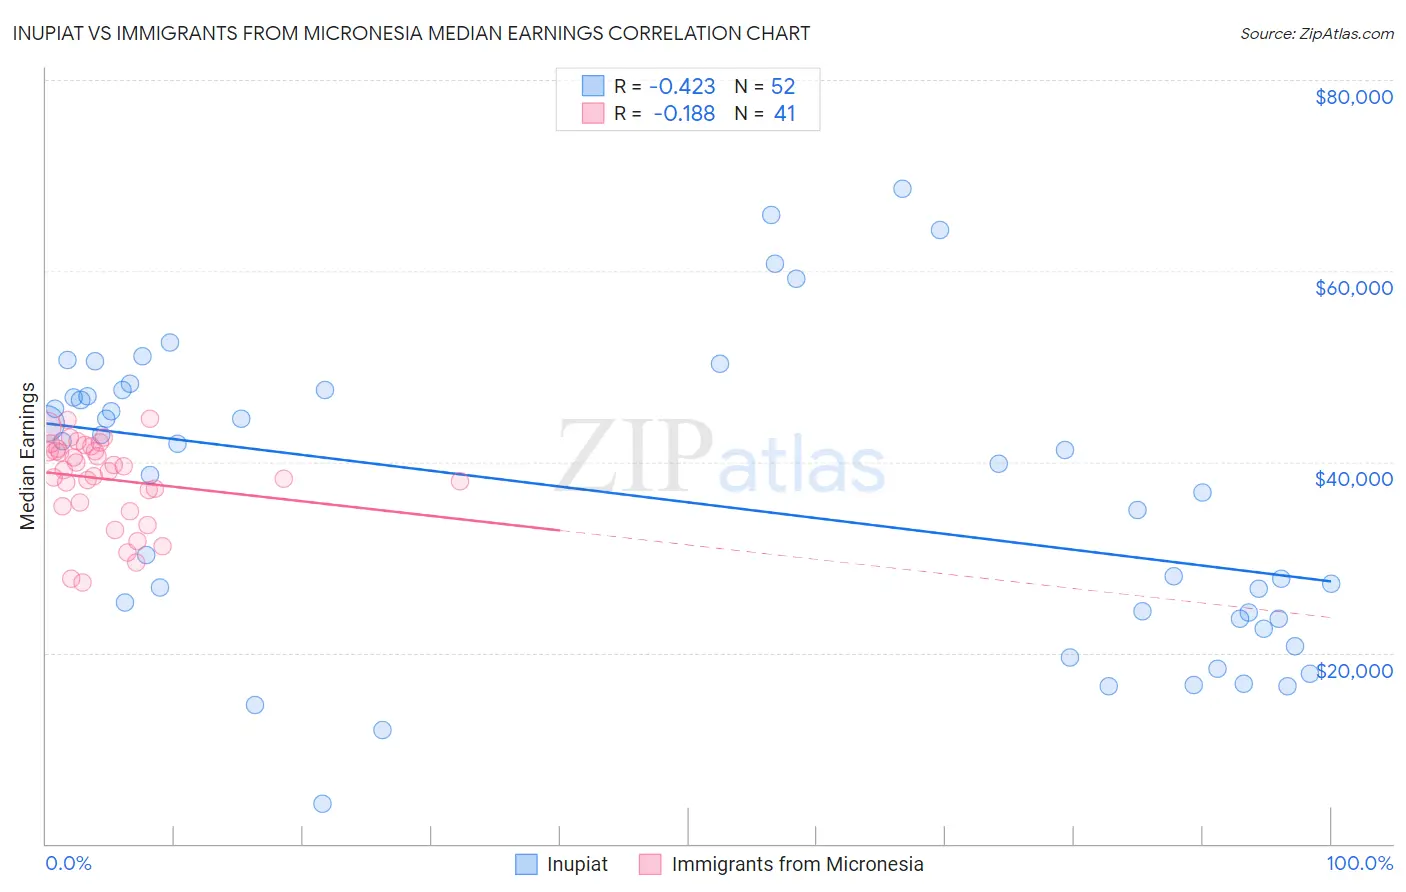
Inupiat vs Immigrants from Micronesia Median Earnings Correlation Chart
The statistical analysis conducted on geographies consisting of 96,339,660 people shows a moderate negative correlation between the proportion of Inupiat and median earnings in the United States with a correlation coefficient (R) of -0.423 and weighted average of $43,000. Similarly, the statistical analysis conducted on geographies consisting of 61,606,741 people shows a poor negative correlation between the proportion of Immigrants from Micronesia and median earnings in the United States with a correlation coefficient (R) of -0.188 and weighted average of $41,133, a difference of 4.5%.
Median Earnings Correlation Summary
| Measurement | Inupiat | Immigrants from Micronesia |
| Minimum | $4,192 | $27,399 |
| Maximum | $68,590 | $44,575 |
| Range | $64,398 | $17,176 |
| Mean | $36,209 | $38,171 |
| Median | $39,208 | $39,090 |
| Interquartile 25% (IQ1) | $23,611 | $35,550 |
| Interquartile 75% (IQ3) | $47,170 | $41,519 |
| Interquartile Range (IQR) | $23,559 | $5,969 |
| Standard Deviation (Sample) | $15,551 | $4,508 |
| Standard Deviation (Population) | $15,401 | $4,452 |
Similar Demographics by Median Earnings
Demographics Similar to Inupiat by Median Earnings
In terms of median earnings, the demographic groups most similar to Inupiat are Immigrants from Jamaica ($43,026, a difference of 0.060%), Nicaraguan ($43,026, a difference of 0.060%), Immigrants from Liberia ($42,923, a difference of 0.18%), Salvadoran ($42,912, a difference of 0.20%), and Immigrants from Somalia ($43,100, a difference of 0.23%).
| Demographics | Rating | Rank | Median Earnings |
| Alaskan Athabascans | 1.4 /100 | #256 | Tragic $43,393 |
| Jamaicans | 1.3 /100 | #257 | Tragic $43,343 |
| French American Indians | 1.3 /100 | #258 | Tragic $43,333 |
| German Russians | 1.1 /100 | #259 | Tragic $43,200 |
| Immigrants | Somalia | 0.9 /100 | #260 | Tragic $43,100 |
| Immigrants | Jamaica | 0.8 /100 | #261 | Tragic $43,026 |
| Nicaraguans | 0.8 /100 | #262 | Tragic $43,026 |
| Inupiat | 0.8 /100 | #263 | Tragic $43,000 |
| Immigrants | Liberia | 0.7 /100 | #264 | Tragic $42,923 |
| Salvadorans | 0.7 /100 | #265 | Tragic $42,912 |
| Immigrants | Laos | 0.7 /100 | #266 | Tragic $42,884 |
| Cree | 0.6 /100 | #267 | Tragic $42,777 |
| Americans | 0.6 /100 | #268 | Tragic $42,742 |
| Belizeans | 0.5 /100 | #269 | Tragic $42,702 |
| Osage | 0.5 /100 | #270 | Tragic $42,651 |
Demographics Similar to Immigrants from Micronesia by Median Earnings
In terms of median earnings, the demographic groups most similar to Immigrants from Micronesia are Immigrants from Caribbean ($41,119, a difference of 0.030%), Guatemalan ($41,205, a difference of 0.17%), Ute ($41,051, a difference of 0.20%), Immigrants from Latin America ($41,049, a difference of 0.20%), and Cherokee ($41,252, a difference of 0.29%).
| Demographics | Rating | Rank | Median Earnings |
| Central American Indians | 0.1 /100 | #291 | Tragic $41,474 |
| U.S. Virgin Islanders | 0.1 /100 | #292 | Tragic $41,448 |
| Immigrants | Zaire | 0.1 /100 | #293 | Tragic $41,325 |
| Potawatomi | 0.1 /100 | #294 | Tragic $41,288 |
| Bangladeshis | 0.1 /100 | #295 | Tragic $41,263 |
| Cherokee | 0.1 /100 | #296 | Tragic $41,252 |
| Guatemalans | 0.1 /100 | #297 | Tragic $41,205 |
| Immigrants | Micronesia | 0.1 /100 | #298 | Tragic $41,133 |
| Immigrants | Caribbean | 0.1 /100 | #299 | Tragic $41,119 |
| Ute | 0.1 /100 | #300 | Tragic $41,051 |
| Immigrants | Latin America | 0.1 /100 | #301 | Tragic $41,049 |
| Shoshone | 0.0 /100 | #302 | Tragic $40,932 |
| Haitians | 0.0 /100 | #303 | Tragic $40,918 |
| Immigrants | Guatemala | 0.0 /100 | #304 | Tragic $40,851 |
| Chickasaw | 0.0 /100 | #305 | Tragic $40,672 |