Syrian vs Immigrants from Micronesia Median Earnings
COMPARE
Syrian
Immigrants from Micronesia
Median Earnings
Median Earnings Comparison
Syrians
Immigrants from Micronesia
$48,934
MEDIAN EARNINGS
97.1/ 100
METRIC RATING
109th/ 347
METRIC RANK
$41,133
MEDIAN EARNINGS
0.1/ 100
METRIC RATING
298th/ 347
METRIC RANK
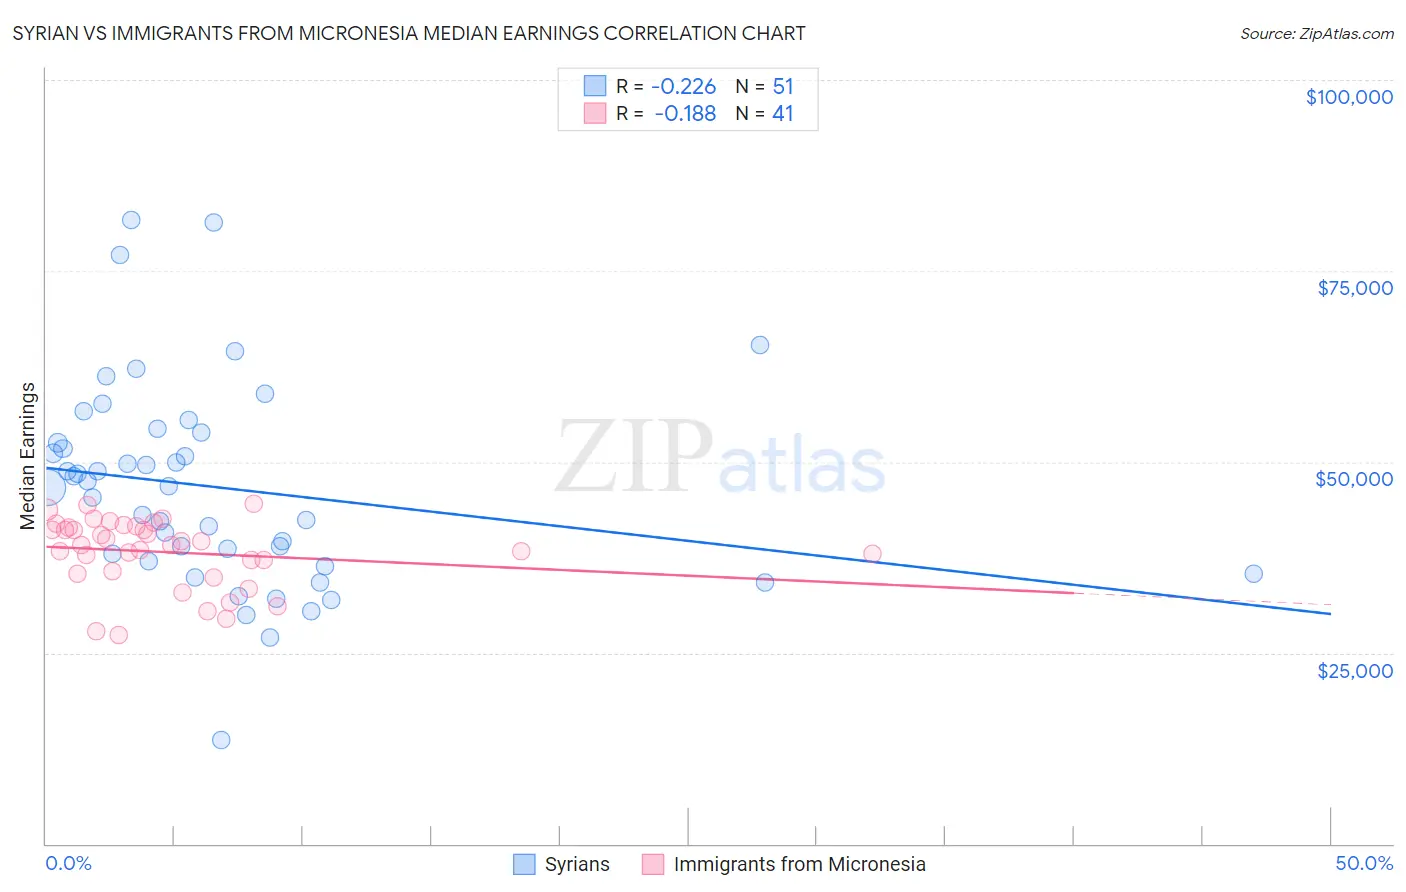
Syrian vs Immigrants from Micronesia Median Earnings Correlation Chart
The statistical analysis conducted on geographies consisting of 266,312,508 people shows a weak negative correlation between the proportion of Syrians and median earnings in the United States with a correlation coefficient (R) of -0.226 and weighted average of $48,934. Similarly, the statistical analysis conducted on geographies consisting of 61,606,741 people shows a poor negative correlation between the proportion of Immigrants from Micronesia and median earnings in the United States with a correlation coefficient (R) of -0.188 and weighted average of $41,133, a difference of 19.0%.
Median Earnings Correlation Summary
| Measurement | Syrian | Immigrants from Micronesia |
| Minimum | $13,611 | $27,399 |
| Maximum | $81,610 | $44,575 |
| Range | $67,999 | $17,176 |
| Mean | $46,643 | $38,171 |
| Median | $46,804 | $39,090 |
| Interquartile 25% (IQ1) | $37,007 | $35,550 |
| Interquartile 75% (IQ3) | $53,802 | $41,519 |
| Interquartile Range (IQR) | $16,795 | $5,969 |
| Standard Deviation (Sample) | $13,425 | $4,508 |
| Standard Deviation (Population) | $13,293 | $4,452 |
Similar Demographics by Median Earnings
Demographics Similar to Syrians by Median Earnings
In terms of median earnings, the demographic groups most similar to Syrians are Immigrants from Ethiopia ($48,924, a difference of 0.020%), Immigrants from Zimbabwe ($48,913, a difference of 0.040%), Northern European ($48,887, a difference of 0.10%), Immigrants from Kuwait ($48,861, a difference of 0.15%), and Moroccan ($48,838, a difference of 0.20%).
| Demographics | Rating | Rank | Median Earnings |
| Ethiopians | 98.8 /100 | #102 | Exceptional $49,572 |
| Austrians | 98.7 /100 | #103 | Exceptional $49,501 |
| Immigrants | Brazil | 98.6 /100 | #104 | Exceptional $49,463 |
| Immigrants | Western Asia | 98.4 /100 | #105 | Exceptional $49,389 |
| Immigrants | Albania | 98.4 /100 | #106 | Exceptional $49,377 |
| Immigrants | Morocco | 98.4 /100 | #107 | Exceptional $49,368 |
| Palestinians | 98.0 /100 | #108 | Exceptional $49,209 |
| Syrians | 97.1 /100 | #109 | Exceptional $48,934 |
| Immigrants | Ethiopia | 97.1 /100 | #110 | Exceptional $48,924 |
| Immigrants | Zimbabwe | 97.0 /100 | #111 | Exceptional $48,913 |
| Northern Europeans | 96.9 /100 | #112 | Exceptional $48,887 |
| Immigrants | Kuwait | 96.8 /100 | #113 | Exceptional $48,861 |
| Moroccans | 96.7 /100 | #114 | Exceptional $48,838 |
| Chinese | 96.7 /100 | #115 | Exceptional $48,836 |
| Koreans | 96.2 /100 | #116 | Exceptional $48,727 |
Demographics Similar to Immigrants from Micronesia by Median Earnings
In terms of median earnings, the demographic groups most similar to Immigrants from Micronesia are Immigrants from Caribbean ($41,119, a difference of 0.030%), Guatemalan ($41,205, a difference of 0.17%), Ute ($41,051, a difference of 0.20%), Immigrants from Latin America ($41,049, a difference of 0.20%), and Cherokee ($41,252, a difference of 0.29%).
| Demographics | Rating | Rank | Median Earnings |
| Central American Indians | 0.1 /100 | #291 | Tragic $41,474 |
| U.S. Virgin Islanders | 0.1 /100 | #292 | Tragic $41,448 |
| Immigrants | Zaire | 0.1 /100 | #293 | Tragic $41,325 |
| Potawatomi | 0.1 /100 | #294 | Tragic $41,288 |
| Bangladeshis | 0.1 /100 | #295 | Tragic $41,263 |
| Cherokee | 0.1 /100 | #296 | Tragic $41,252 |
| Guatemalans | 0.1 /100 | #297 | Tragic $41,205 |
| Immigrants | Micronesia | 0.1 /100 | #298 | Tragic $41,133 |
| Immigrants | Caribbean | 0.1 /100 | #299 | Tragic $41,119 |
| Ute | 0.1 /100 | #300 | Tragic $41,051 |
| Immigrants | Latin America | 0.1 /100 | #301 | Tragic $41,049 |
| Shoshone | 0.0 /100 | #302 | Tragic $40,932 |
| Haitians | 0.0 /100 | #303 | Tragic $40,918 |
| Immigrants | Guatemala | 0.0 /100 | #304 | Tragic $40,851 |
| Chickasaw | 0.0 /100 | #305 | Tragic $40,672 |